OPEN-SOURCE SCRIPT
Zig Zag/Consecutive Bars [UkutaLabs]
Uppdaterad
█ OVERVIEW
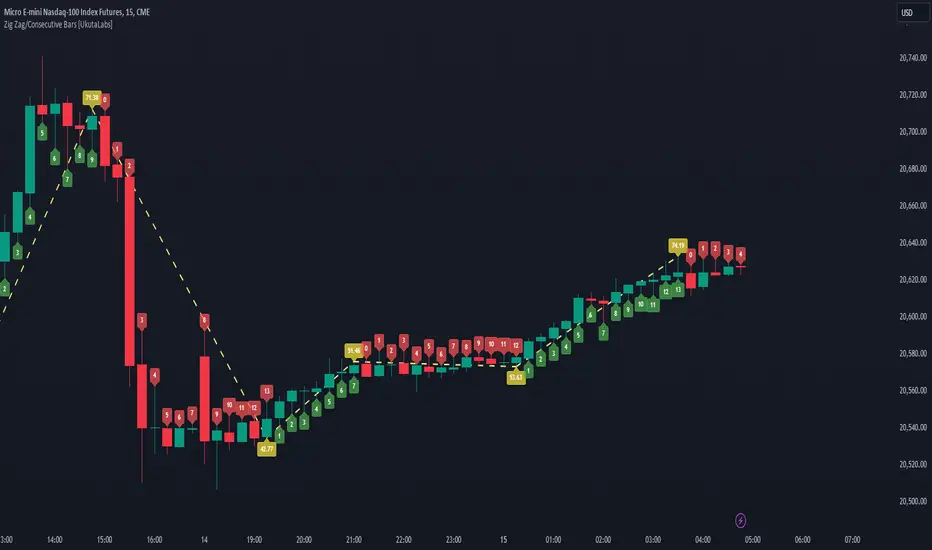
The Zig Zag/Consecutive Bars indicator is a powerful trading tool that helps to visualise the flow of the market. This indicator allows users to see at a glance when a candle closes at a new high or a new low, which can be incorporated into a variety of trading strategies to better understand points of reversal and consolidation.
This indicator also displays the RSI score of each pivot, as well as a trailing count of how many bars it has been since there was a new high/low.
█ USAGE
As each bar finishes, the script will check if it closed above or below the previous bar’s high or low, depending on the current trend direction. When a new high or low is set, the script will then look for a move in the other direction. This can be a powerful tool that can identify when the market is trending strongly, as well as identifying when the market has a weak or no trend.
At each pivot point, the RSI score is displayed. This serves as additional confirmation to how strong the trend is. The RSI labels can be turned off in the settings.
As each trend develops, the script will count and display the number of bars that have closed since the most recent pivot. These labels can be turned off in the settings.
█ SETTINGS
Configuration
• Show RSI Scores: Determines whether or not labels displaying RSI scores are drawn.
• Show Counter: Determines whether or not labels displaying the number of bars since the most recent pivot are drawn.
• Line Color: Determines the color of the Zig Zag line.
Versionsinformation
- Fixed a small bug that caused the first bar of the count to be 0.Versionsinformation
- Added a new setting: Change Bar Color. This setting will change the colors of bars depending on whether the zig zag last finished at a low or a high, regardless of whether the bar finished above or below its opening price.- Added a new setting: Bullish Color. This setting determines the color of bars in a bullish trend when the Change Bar Color setting is toggled.
- Added a new setting: Bearish Color. This setting determines the color of bars in a bearish trend when the Change Bar color setting is toggled.
Skript med en öppen källkod
In true TradingView spirit, the author of this script has published it open-source, so traders can understand and verify it. Cheers to the author! You may use it for free, but reuse of this code in publication is governed by House rules. Du kan ange den som favorit för att använda den i ett diagram.
Frånsägelse av ansvar
Informationen och publikationerna är inte avsedda att vara, och utgör inte heller finansiella, investerings-, handels- eller andra typer av råd eller rekommendationer som tillhandahålls eller stöds av TradingView. Läs mer i Användarvillkoren.