OPEN-SOURCE SCRIPT
Sector Performance v0.3
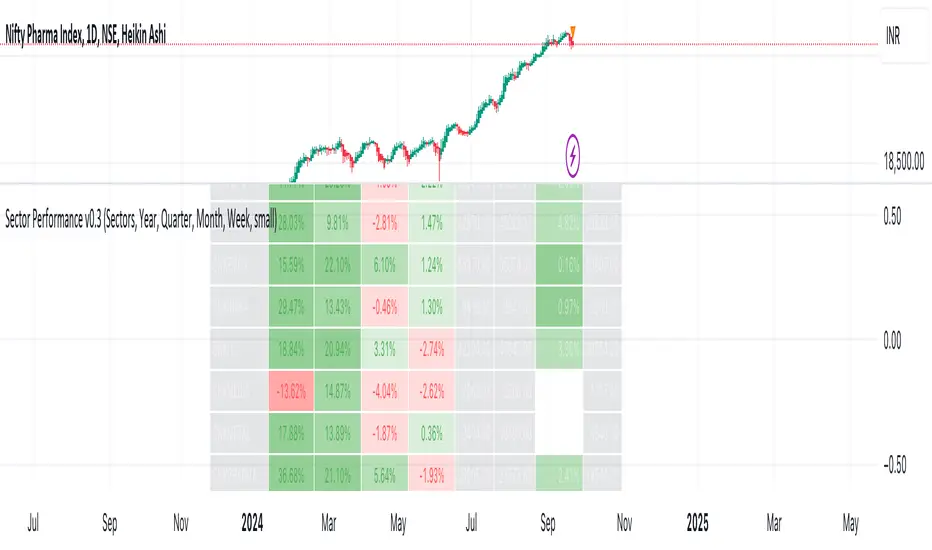
Sector Performance Dashboard v0.3 (Work In Progress)
- Provides a comprehensive view of sector and stock performance across multiple timeframes
Features:
- Displays performance data for various Indian market sectors and their constituent stocks
- Allows selection of different sector groups (e.g., NIFTY, BANKNIFTY, CNXAUTO, etc.)
- Shows performance over four customizable time periods (default: Year, Quarter, Month, Week)
- Calculates percentage change for each time period
- Presents current price, 250-day high and low, and percentage distance from these extremes
- Uses color-coding to quickly identify positive (green) and negative (red) performance
- Adjustable text size for better visibility
- Functionality:
- Creates a table in the center of the chart
- Populates the table with up to 15 symbols per sector
- Updates data in real-time on daily timeframe
- Allows for easy comparison of different stocks within a sector
- User Inputs:
- Sector selection
- Four customizable date inputs for different time periods
- Adjustable text size for the table
- Use Cases:
- Quick sector rotation analysis
- Identifying outperforming and underperforming stocks within a sector
- Monitoring multiple timeframes simultaneously for comprehensive market view
- Assisting in stock screening and selection process
Skript med en öppen källkod
In true TradingView spirit, the author of this script has published it open-source, so traders can understand and verify it. Cheers to the author! You may use it for free, but reuse of this code in publication is governed by House rules. Du kan ange den som favorit för att använda den i ett diagram.
Frånsägelse av ansvar
Informationen och publikationerna är inte avsedda att vara, och utgör inte heller finansiella, investerings-, handels- eller andra typer av råd eller rekommendationer som tillhandahålls eller stöds av TradingView. Läs mer i Användarvillkoren.