PROTECTED SOURCE SCRIPT
SMCL - Trend Change Structures
SMCL Indicator - Detailed Functionality
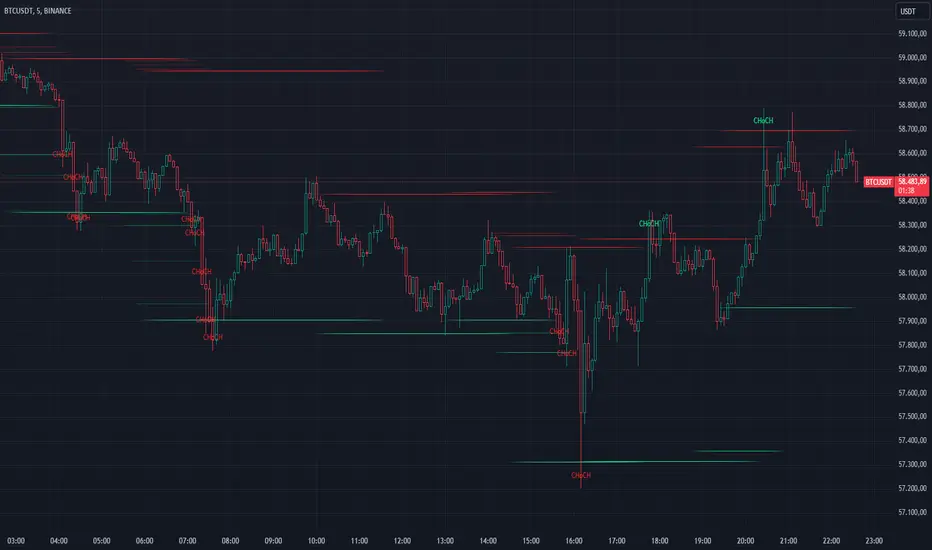
The SMCL (Structure Market Change Levels) indicator is designed to help traders visually detect and analyze changes in market structure. It focuses on identifying key pivot points and possible trend reversals by marking Change of Character (CHoCH) signals and calculating important levels like Premium and Discount zones.
Key Features:
Bullish and Bearish Structure Detection: Marks key trend changes on the chart using price pivots, with options to display only bullish or bearish structures.
Premium and Discount Zones Visualization: Identifies areas where the price may be in an overbought (Premium) or oversold (Discount) zone.
Win Rate Calculation: Calculates and displays the win rate on the chart to help you assess the indicator's effectiveness in real-time.
Full Customization: Adjust the colors of the structures and Premium/Discount zones to match your analysis style.
How to Use:
Bullish Structures: Look for CHoCH labels above recent highs indicating a potential shift to an uptrend.
Bearish Structures: Watch for CHoCH labels below recent lows indicating a potential shift to a downtrend.
Premium/Discount Levels: Use these zones to identify potential overbought or oversold conditions, ideal for planning entries or exits.
Win Rate: Monitor the win rate to gauge the reliability of the indicator over time.
This indicator is ideal for both intraday traders and swing traders looking for a simple yet powerful tool to identify market trend changes. Try it out and improve your trading decisions!
Technical Details:
1. Inputs:
Structure Period (prd): Defines the lookback period for detecting significant highs and lows (pivots). A higher period will consider a broader price range, identifying more prominent structures.
Response Period (resp): Determines how reactive the indicator is to recent price movements, affecting how quickly new structures are identified.
Show Bullish Structure (bull): A toggle to display bullish (uptrend) market structures on the chart.
Show Bearish Structure (bear): A toggle to display bearish (downtrend) market structures on the chart.
Show Premium & Discount (showPD): When enabled, the indicator will draw Premium (overbought) and Discount (oversold) levels on the chart.
2. Colors:
Bullish Color (bullColor): The color used to highlight bullish market structures.
Bearish Color (bearColor): The color used to highlight bearish market structures.
Premium Color (premColor): The color used to display the Premium (overbought) level.
Discount Color (discColor): The color used to display the Discount (oversold) level.
3. Structure Detection:
High and Low Pivot Points (Up, Dn): The indicator continuously tracks the highest and lowest prices over the specified structure period (prd). These pivot points are used to identify potential trend changes.
Change of Character (CHoCH) Detection:
When a new high is detected (Up > previous Up), it signifies a potential bullish trend change. A label with "CHoCH" is placed on the chart, if bullish structures are enabled.
Similarly, when a new low is detected (Dn < previous Dn), it signifies a potential bearish trend change. A "CHoCH" label is placed if bearish structures are enabled.
4. Premium & Discount Levels:
Premium Level (PremiumTop): Calculated as 10% below the detected high pivot. It represents a zone where the price may be considered overbought, suggesting a possible reversal or pullback.
Discount Level (DiscountTop): Calculated as 10% above the detected low pivot. It represents a zone where the price may be considered oversold, suggesting a possible buying opportunity.
These levels are drawn on the chart if the showPD option is enabled, helping traders visually assess the market's condition.
5. Probability Calculation:
Win Rate Calculation (WinRate): The indicator tracks the number of times the market structure changes from bullish to bearish and vice versa. It calculates the win rate as the ratio of bullish to bearish changes, providing insight into the strength of the detected structures.
This win rate is displayed on the chart in the latest bar, giving a real-time assessment of the indicator's performance.
6. Display Options:
The indicator offers full customization of colors and visibility for different components, allowing traders to tailor the visuals to their preferences.
Labels and lines are drawn with a 50% opacity by default, making them less intrusive while still visible on the chart.
Frånsägelse av ansvar
Informationen och publikationerna är inte avsedda att vara, och utgör inte heller finansiella, investerings-, handels- eller andra typer av råd eller rekommendationer som tillhandahålls eller stöds av TradingView. Läs mer i Användarvillkoren.