OPEN-SOURCE SCRIPT
Demand and Supply Conditions with Signals
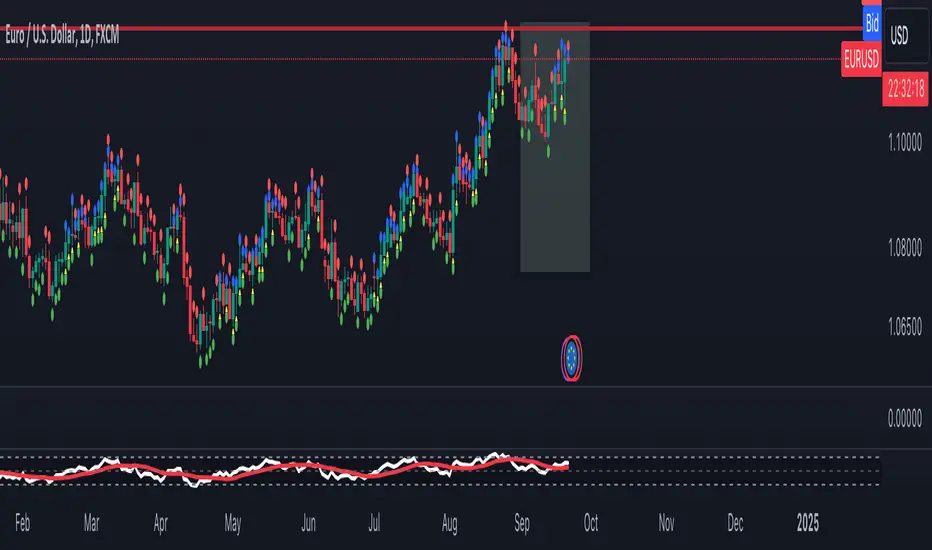
This document outlines a trading strategy that utilizes price action analysis and color signals to make informed trading decisions. The strategy focuses on identifying demand and supply conditions, curve patterns, and generating signals based on historical price data. The colors associated with each condition and signal serve as visual indicators to assist in decision-making.
I. Strategy Overview:
Objective:
The objective of this trading strategy is to identify potential trading opportunities based on price action analysis and color signals.
Key Components:
Demand Condition: A green upward-facing triangle indicates a potential demand condition.
Supply Condition: A red downward-facing triangle indicates a potential supply condition.
Curve Pattern Condition: A blue upward-facing triangle indicates a potential curve pattern condition.
Signal Condition: A yellow upward-facing triangle indicates a potential buy signal.
II. Understanding the Colors:
* Green: Represents the demand condition, which suggests potential buying pressure in the market. A green upward-facing triangle is plotted on the chart when the demand condition is met at a specific candle or bar.
* Red: Represents the supply condition, which suggests potential selling pressure in the market. A red downward-facing triangle is plotted on the chart when the supply condition is met at a specific candle or bar.
* Blue: Represents the curve pattern condition, which suggests the presence of a specific pattern based on price action analysis. A blue upward-facing triangle is plotted on the chart when the curve pattern condition is met at a specific candle or bar.
* Yellow: Represents the signal condition, which is a combination of the demand condition and the curve pattern condition. A yellow upward-facing triangle is plotted on the chart when the signal condition is met at a specific candle or bar, indicating a potential buy signal.
III. Decision-Making Process:
* Demand and Supply Conditions: Identify potential buying opportunities when a green demand condition is present. Consider potential selling opportunities when a red supply condition is present. Use these conditions to assess the overall market sentiment and potential price reversals.
* Curve Patterns: Analyze the presence of blue curve pattern conditions to identify specific price patterns. These patterns can provide additional confirmation for potential trading decisions.
* Signal Condition: Pay attention to the yellow signal condition, which indicates a potential buy signal. Evaluate the overall market context and consider entering a buy position when the signal condition is met.
* Risk Management: Implement proper risk management techniques such as setting stop-loss orders and position sizing to protect against potential losses.
IV. Conclusion:
This trading strategy leverages price action analysis and color signals to identify potential trading opportunities. The colors associated with each condition and signal serve as visual aids to highlight specific points on the chart. It's important to thoroughly backtest and validate the strategy before applying it to real-world trading scenarios. Additionally, always consider market conditions, risk management, and individual trading preferences when making trading decisions.
Disclaimer: Trading involves risks, and this document does not guarantee profitable outcomes. Traders should exercise caution and perform their own due diligence before engaging in any trading activity.
Remember to continually review and adapt your trading strategy based on market conditions and personal experiences to enhance its effectiveness.
Skript med en öppen källkod
In true TradingView spirit, the author of this script has published it open-source, so traders can understand and verify it. Cheers to the author! You may use it for free, but reuse of this code in publication is governed by House rules. Du kan ange den som favorit för att använda den i ett diagram.
Frånsägelse av ansvar
Informationen och publikationerna är inte avsedda att vara, och utgör inte heller finansiella, investerings-, handels- eller andra typer av råd eller rekommendationer som tillhandahålls eller stöds av TradingView. Läs mer i Användarvillkoren.