PROTECTED SOURCE SCRIPT
Bubbles Dector
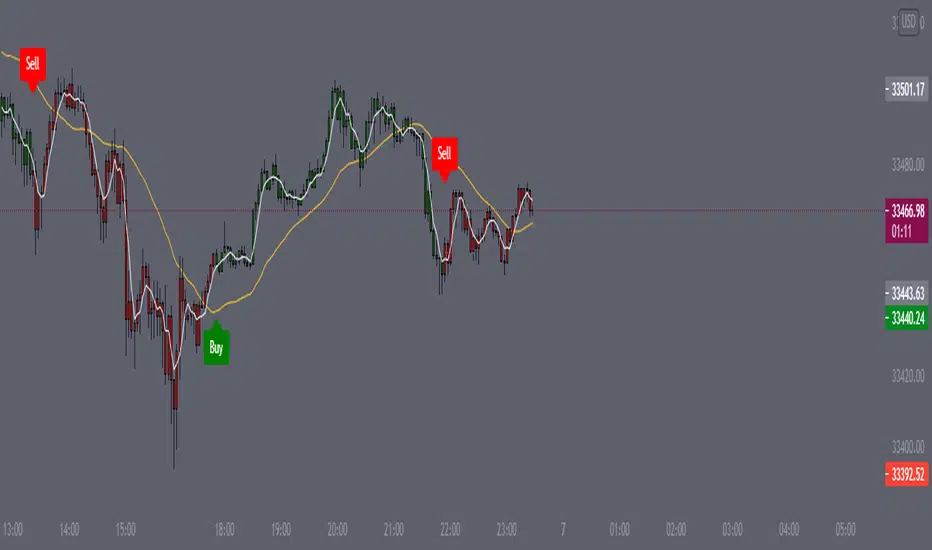
In this version of my indicator, you can see the trend in the bars themselves, this is an extremely accurate view of how the market is performing on a lower scale timeframe.
The indicator calculates the buy and sell signals using HLC3, Simple Moving Average ( SMA ), and the Exponential Moving Average ( EMA ) as soon as they cross. This indicator is useful with time intervals starting at 3m .
I have already tested many other timeframes, the 3m gives the most logical point of view when trying to enter the market. I've also been able to see how the buy/sells signals perform, which they perform well if you're using ZONES. This is to note they help once you're able to see where the wick rejects.
Frånsägelse av ansvar
Informationen och publikationerna är inte avsedda att vara, och utgör inte heller finansiella, investerings-, handels- eller andra typer av råd eller rekommendationer som tillhandahålls eller stöds av TradingView. Läs mer i Användarvillkoren.