OPEN-SOURCE SCRIPT
RSI Tree
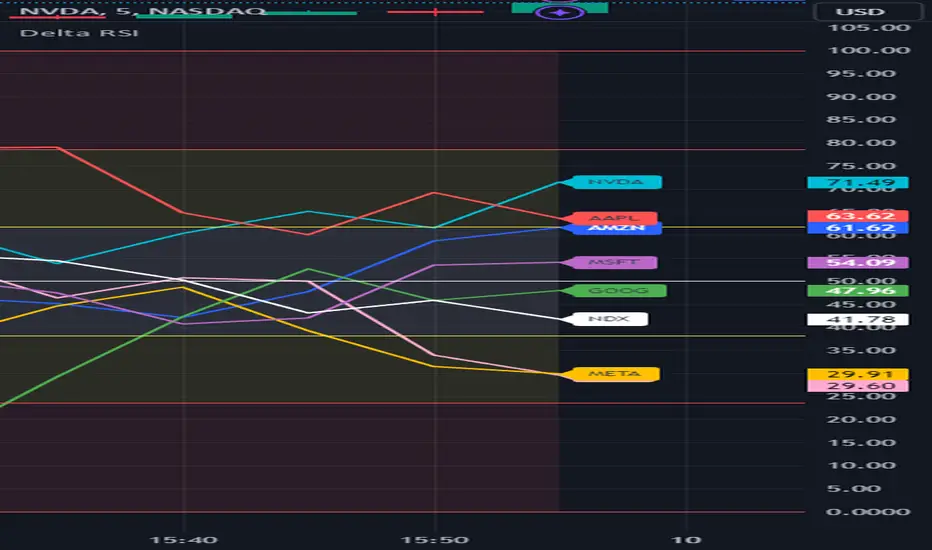
RSI Tree is a simple way to compare the strength of several different instruments against each other.

The default is to compare MSFT, NVDA, TSLA, GOOG, META, AMZN, AAPL and NASDAQ. You could do the same for currency pairs and any other instruments available in Trading View. However, it makes the most sense to compare seven instruments to an eighth underlying instrument. As you can see in the default values, we included the NASDAQ as the eighth instrument since the other seven are part of the NASDAQ composite index. If you were to trade major currency pairs, then your eighth instrument would most likely be the U.S. Dollar (DXY).
The chart setup is important as well. You need to split your chart horizontally into 4 plots. Each plot would be at a different timing interval. The example shows 4 hr, 1 hr, 15 min and 5 min (left to right) charts. Now not only can we compare the instruments against each other, but we can do it across time to get an idea of the motion of each instrument.
Note, the instrument used on the chart is somewhat important. If the chart is set to a currency pair, but you have the RSI Tree setup for equities (as in the default) then you will get some odd behavior due to the times when these are open. Equities are 0930 to 1600 EST, whereas something like a currency would be open 24 hours a day.
Layout for default settings: tradingview.com/chart/DqwSXvEH/
Bugs?
Kindly report any issues and I'll try to fix them promptly.
Thank you!
Skript med en öppen källkod
In true TradingView spirit, the author of this script has published it open-source, so traders can understand and verify it. Cheers to the author! You may use it for free, but reuse of this code in publication is governed by House rules. Du kan ange den som favorit för att använda den i ett diagram.
Frånsägelse av ansvar
Informationen och publikationerna är inte avsedda att vara, och utgör inte heller finansiella, investerings-, handels- eller andra typer av råd eller rekommendationer som tillhandahålls eller stöds av TradingView. Läs mer i Användarvillkoren.