OPEN-SOURCE SCRIPT
Color Coded RSI [Phantom]
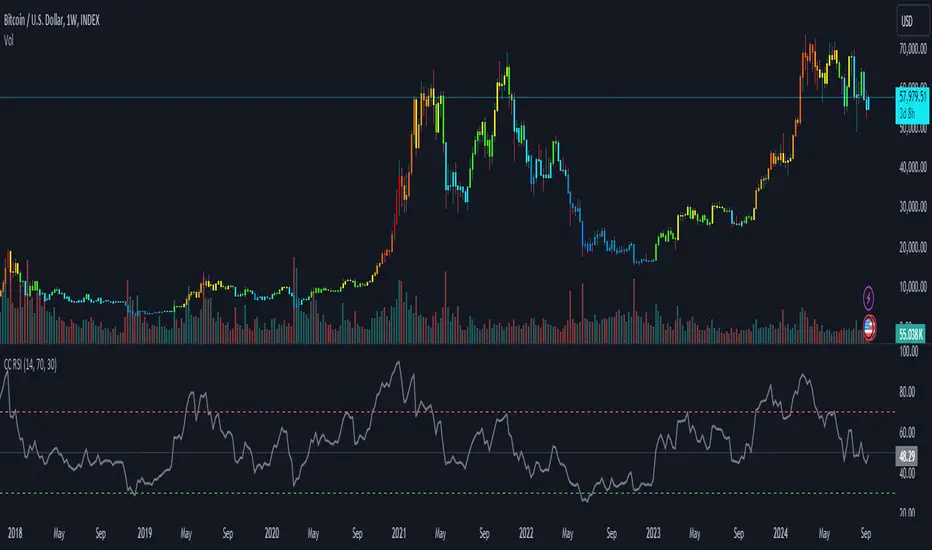
The Color Coded RSI enhances the standard RSI (Relative Strength Index) by applying dynamic color coding to the price bars, making it easier to visualize RSI levels directly on the chart.
Key Feature:
RSI-Based Color Coding: Price bars change color based on RSI values. High RSI values (above 70) show warm colors (red/orange), signaling potential overbought conditions, while low RSI values (below 30) display cool colors (blue), indicating possible oversold levels.
How to Trade with Color Coded RSI:
Overbought (Red/Orange Bars):
When the bars turn red or orange (RSI above 70), the market might be overbought. This could be a signal to sell or exit long positions, expecting a pullback.
Oversold (Blue Bars):
Blue bars (RSI below 30) suggest the market is oversold. Look for buying opportunities or consider exiting short positions, anticipating a rebound.
Neutral (Gray/Green Bars):
Gray or green bars (RSI near 50) indicate neutral conditions. You may want to wait for a clearer trend before taking action.
RSI is best used with other indicators to provide confirmations.
Skript med en öppen källkod
In true TradingView spirit, the author of this script has published it open-source, so traders can understand and verify it. Cheers to the author! You may use it for free, but reuse of this code in publication is governed by House rules. Du kan ange den som favorit för att använda den i ett diagram.
Frånsägelse av ansvar
Informationen och publikationerna är inte avsedda att vara, och utgör inte heller finansiella, investerings-, handels- eller andra typer av råd eller rekommendationer som tillhandahålls eller stöds av TradingView. Läs mer i Användarvillkoren.