PROTECTED SOURCE SCRIPT
ATRP (Average True Range Percent)
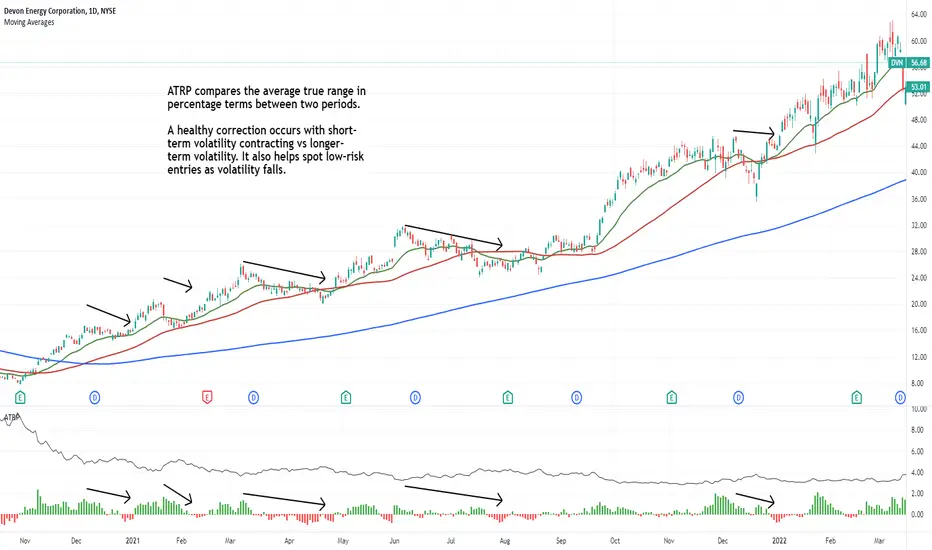
ATRP compares the average true range in percentage terms between two periods. A healthy correction occurs with short-term volatility contracting vs longer-term volatility. It also helps spot low-risk entries as volatility falls.
I also included the historical average true range in percentage terms so an investor can quickly visualize what a likely daily range will be.
In my experience, it is vital to apply this analysis to stocks trending above their 50 and 200-day moving averages as stocks in downtrends can keep falling for extended periods of time with dwindling volatility.
Get access to CarusoInsights indicators: carusoinsights.com/charting/
Frånsägelse av ansvar
Informationen och publikationerna är inte avsedda att vara, och utgör inte heller finansiella, investerings-, handels- eller andra typer av råd eller rekommendationer som tillhandahålls eller stöds av TradingView. Läs mer i Användarvillkoren.