INVITE-ONLY SCRIPT
Orderflow Pack v.1.00
Uppdaterad

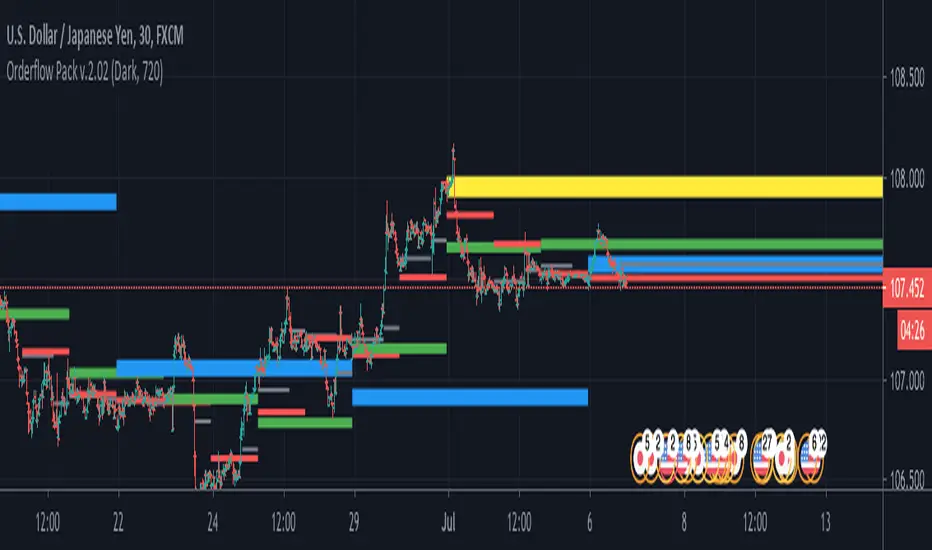
The orderflow indicator allows you to display the fair price (vPOC) of higher timeframes, 8h, 12h, daily, weekly, monthly and year. These levels appear as horizontal lines in the graph and act like a magnet to price. This lines can not be turned off.
8h - thin white line
12h - thin yellow line
Day - thin red line
Week - thick blue line
Month - thick yellow line
Year - thick red line
The POC on each candle is displayed on the 5m, 30m and 240m charts TF only , 1 minute data are used for the calculation. The algorithm used to calculate the Volume fair price ( POC ) is VWAP. Volume delta can be displayed on the 5m and 30m chart TF only , Volume delta is only an approximate value calculated from the volume value per 1m TF and the shape of the candles. However, it can be used as a supplement to our analysis. The value of the delta on the candle that is being formed is not relevant, it is necessary to wait for the candle to end so that the Volume delta has a telling value for us.
Please note that in order to display data from lower time frames (1m) correctly, it is necessary to reload the page in the browser after developing candle close. It is also not possible to use alerts.
The reason for using only selected TFs for POC on a candle and Volume Delta is the necessary calculation power for the script.
send PM or visit website to get access
Versionsinformation
Minor code change, dark and light template colors, speed improvementVersionsinformation
3.7.2020 Major Code change, POC visible only on 30m candles, multi TF lines with description can be turned off, in previous version lines moved not good with correlation to price scale, now the problem is solved.Versionsinformation
6.7.2020 minor code update, added custom timeframe settingVersionsinformation
changed default setting in the script. New user defined line is in default off, color of the line is purple.Endast inbjudanskript.
Tillgången till detta skript är begränsat till användare som har godkänts av författaren och kräver vanligtvis betalning. Du kan lägga till det till dina favoriter men du kan bara använda det efter att ha begärt och fått författarens tillstånd. Contact Asanato for more information, or follow the author's instructions below.
TradingView does not suggest paying for a script and using it unless you 100% trust its author and understand how the script works. In many cases, you can find a good open-source alternative for free in our Community Scripts.
Vill du använda det här skriptet i ett diagram?
Warning: please read before requesting access.
Frånsägelse av ansvar
Informationen och publikationerna är inte avsedda att vara, och utgör inte heller finansiella, investerings-, handels- eller andra typer av råd eller rekommendationer som tillhandahålls eller stöds av TradingView. Läs mer i Användarvillkoren.