INVITE-ONLY SCRIPT
Quantitative R-Difference Trading Strategy/System
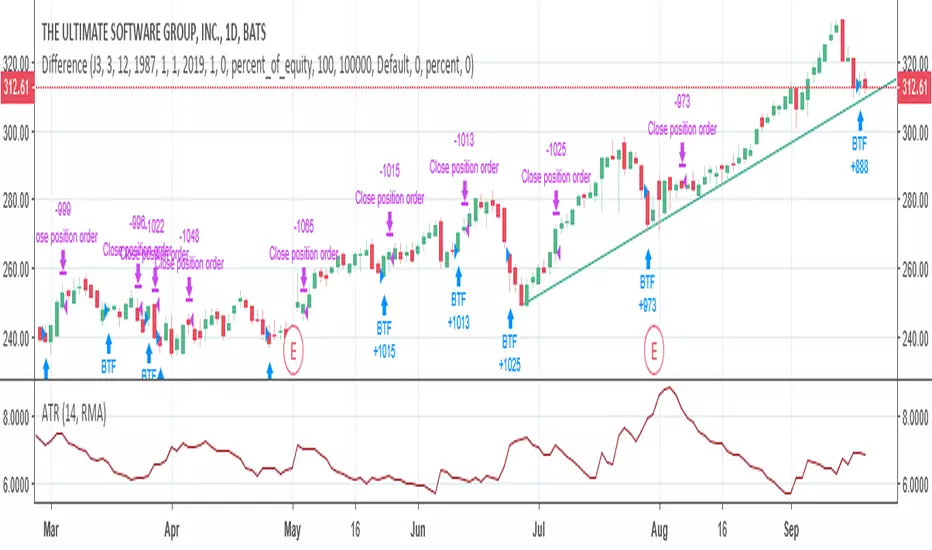
Works extremely well with many stocks.
This strategy was tested on all components of the Dow since 1987. It averaged 22% a year. Slippage and commission were accounted for. 70% of the trades were profitable. The average maximum drawdown was around 15%.
This strategy has also been tested against random. The results indicate that this strategy's results are not due to random chance, but rather it has an edge in the stock market.
Does not repaint, and is not a curve fitted strategy.
Endast inbjudanskript.
Tillgången till detta skript är begränsat till användare som har godkänts av författaren och kräver vanligtvis betalning. Du kan lägga till det till dina favoriter men du kan bara använda det efter att ha begärt och fått författarens tillstånd. Contact tradingstrategies for more information, or follow the author's instructions below.
TradingView does not suggest paying for a script and using it unless you 100% trust its author and understand how the script works. In many cases, you can find a good open-source alternative for free in our Community Scripts.
Vill du använda det här skriptet i ett diagram?
Warning: please read before requesting access.
Frånsägelse av ansvar
Informationen och publikationerna är inte avsedda att vara, och utgör inte heller finansiella, investerings-, handels- eller andra typer av råd eller rekommendationer som tillhandahålls eller stöds av TradingView. Läs mer i Användarvillkoren.