PROTECTED SOURCE SCRIPT
Saral Relative Strength Comparison
### Overview
The Relative Strength (RS) Indicator is a robust tool designed to measure the performance of sectors or stocks relative to a benchmark index. This indicator provides a comprehensive way to compare the relative strength of different sectors or stocks, with the default selection being the major sectors of the National Stock Exchange (NSE). It allows traders to analyze which sectors or stocks are outperforming or underperforming the benchmark over a specific period.
The RS compares how much a security's price has changed over a given period relative to the change in price of a benchmark over the same period. The result is expressed as a percentage, showing whether the security has outperformed or underperformed the benchmark. Positive RS values indicate outperformance, while negative values signal underperformance.
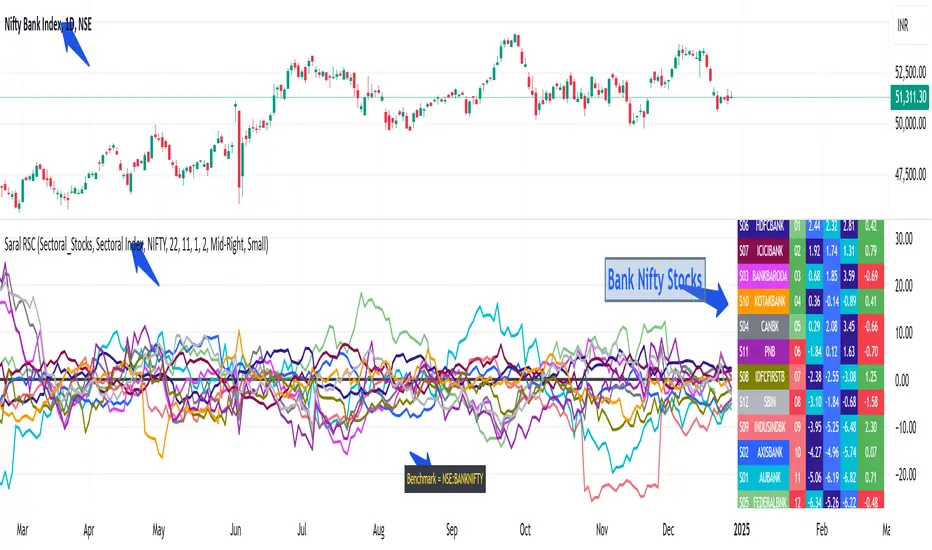
This indicator provides a dual representation of the data. RS values are displayed in both line charts and a table. The line charts provide a visual representation of trends, while the table offers a clear numerical comparison of the current, previous, and earlier RS values along with the rank of the sector/stock.
### Key Features
- Benchmark & Sectors/Stocks Comparison:
Users can select a benchmark index (default: NIFTY 50) and up to 20 sectors or stocks for comparison. By default, the indicator includes the major sectors of NSE, but users can customize the selection as needed. - Customizable RS Calculation:
Users can set the period for RS calculation, with a default of 22 periods, providing flexibility to match different trading strategies. - Flexible Time Frame:
RS calculations are based on the time frame of the main chart, allowing users to seamlessly switch between different periods, from minutes to hours, days, weeks, or even months depending on their analysis needs. - Customizable Line Chart:
Users can adjust the width and color of the RS lines for each sector, making it easier to distinguish between different sectors on the chart. - Dynamic Table Display:
The indicator includes a toggle to display a table of RS values, with customizable position, toggle for background color coding, and selection for text color & size. This makes it easy to compare the RS values across multiple sectors at a glance. - Sorting Options:
The table can be sorted either by alphabetical order of sector/stock names or by their rank. The default sorting is by rank, but switching to alphabetical order helps to identify data of specific sector with ease. - Ranking System:
The table includes a column displaying the rank of each sector or stock based on their RS, with the top-performing items listed first by default. This helps users quickly identify market leaders and laggards. - Color-Coded Backgrounds:
The background color of the sector/stock names in the table corresponds to the colors of their RS lines on the chart, making it easy to correlate table data with the visual plots. Also, the table uses a color-coding system which shows ranks of RS Positive sectors with Green background and RS Negative sectors with Red background. Similarly, the maximum RS value of individual sector is highlighted in Navy Blue, the minimum in Aqua and other in Blue background. This visual aid helps users quickly identify the performance trend of individual sector. - Table Positioning:
The table can be positioned at different locations on the chart (Top Right, Middle Right, Bottom Right, Top Left, Middle Left, Bottom Left), ensuring it doesn't obstruct important chart data.
### Input - RS Parameters:
- Benchmark: Ticker ID of the comparative security. The default benchmark is the NIFTY 50 index, but users can select any other ticker as the benchmark for comparison.
- Period-RS: The period for calculating the RS line. The default period is 22, but users can adjust this to suit their trading strategy and to analyze different time horizons for sector performance.
- Line Width: Determines the thickness of the RS line in the chart. The default width is 2, providing a clear visual distinction between different sectors.
### Input - Table Parameters:
- Show Table: Toggle to display or hide the table, allowing users to switch between graphical and tabular data representations.
- Table Sorting: Users can sort the table alphabetically or by RS rank. The default sorting is by rank.
- Table Position: Allows users to select the position of the table on the chart. Options include Top Right, Middle Right, Bottom Right, Top Left, Middle Left, and Bottom Left. The default position is Middle Right.
- Color Code for Background: The background of the sector/stock names corresponds to their plot colors for easy mapping between plot and table values. Rank of RS Positive sectors will be highlighted with Green background and RS Negative sectors will be highlighted with Red color. The background color of the RS values in the table will change based on their magnitude. The highest RS value is Navy Blue, the lowest is Aqua, and other is Blue. This visual aid helps users quickly identify the performance of which sectors are improving or deteriorating.
- Text Color: Users can select the color of the text displayed in the table. The default text color is White, ensuring readability against various background colors.
- Text Size: Allows users to choose the size of the text in the table. Options include Auto, Tiny, Small, Medium, and Large, with the default being Small. This customization ensures that the table remains legible on different chart sizes.
### Input - Sectors/Stocks:
- Sector/Stock Selection: Users can select which sectors to include as well as how many sectors to include in the analysis. The default sectors are major sectors of the National Stock Exchange, India. The selected sectors will be plotted as RS lines on the chart and will also appear in the table.
- Color: Allows users to choose the color for each sector's RS line, making it easy to distinguish between them on the chart.
### Acknowledgement
This indicator is developed based on the concept discussed by Mr. Subhadip Nandy in Trader's Talk with Mr. Rohit Katwal.
Frånsägelse av ansvar
Informationen och publikationerna är inte avsedda att vara, och utgör inte heller finansiella, investerings-, handels- eller andra typer av råd eller rekommendationer som tillhandahålls eller stöds av TradingView. Läs mer i Användarvillkoren.