OPEN-SOURCE SCRIPT
Overlay Higher Timeframe EMA 10
Uppdaterad
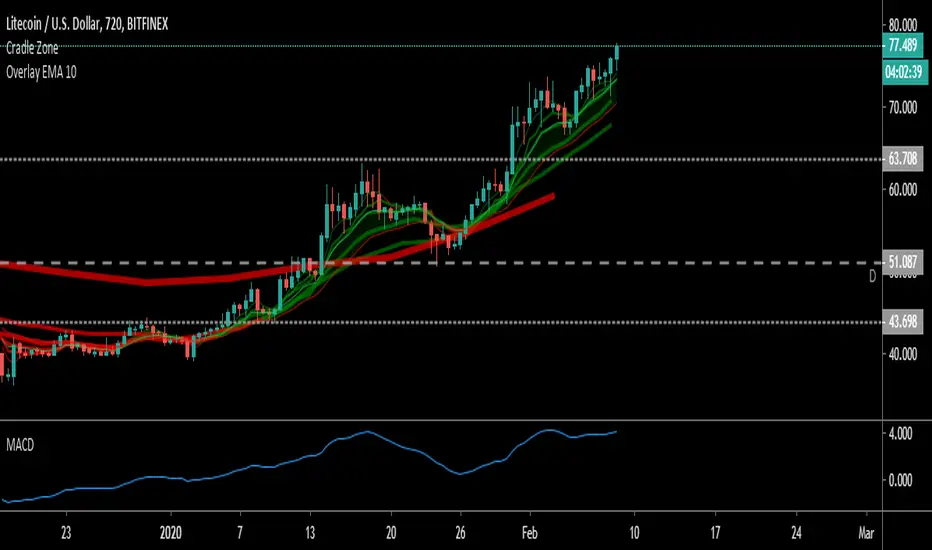
Plot the daily and weekly EMA 10 on any timeframe.
The Daily EMA 10 is useful for helping a trader decide whether the price is overextended without switching back to the daily timeframe and losing focus. It will change colour to indicate which order the EMA 10 and EMA 20 is in.
The Weekly EMA 10 is useful for helping a trader decide whether to take a trade based on long term momentum. If it is over the current price then the market has more momentum to the downside and if it is under then the market has more momentum to the upside. It will also change colour depending on which order the EMA 10 and EMA 20 is in. The weekly is often forgotten in trade planning.
You can switch the Daily and the Weekly on and off independently and change styles if you wish.
Versionsinformation
More timeframes.The best way to use this indicator is to pick the next timeframe up from the timeframe you are trading on.
When the price pulls back for a trade - use the higher timeframe to determine whether it is in an optimal place to trade or whether it is likely to pull back further to meet the higher EMA.
Skript med en öppen källkod
In true TradingView spirit, the author of this script has published it open-source, so traders can understand and verify it. Cheers to the author! You may use it for free, but reuse of this code in publication is governed by House rules. Du kan ange den som favorit för att använda den i ett diagram.
Frånsägelse av ansvar
Informationen och publikationerna är inte avsedda att vara, och utgör inte heller finansiella, investerings-, handels- eller andra typer av råd eller rekommendationer som tillhandahålls eller stöds av TradingView. Läs mer i Användarvillkoren.