Fractal

Asian Range + Midpoint + Liquidity Grab AlertsPlot Asian Range 12am to 08am GMT with Midpoint and Liquidity Grab Alerts


Haniva ATRHaniva ATR Indicator
This indicator is fully based on ATR (Average True Range) calculations and is designed for analyzing behavior of price movement. It is tailored for traders who follow the BPM style.
Applications of the indicator:
1- Yellow candles represent inside bars, and you can trade them with inside bar hunt setup.
2- The ATR table calculates Average True Range values across multiple timeframes for better volatility assessment.
3- The Stop Loss & Target table provides suggested stop loss and target levels, dynamically calculated based on each timeframe’s ATR.
4- Long shadows (wicks) are highlighted in the chart, and their 50% zones are clearly marked to assist with identifying potential reversal or reaction points.
5- The indicator also defines key percentages used to determine the leg timeframe, helping traders align their setups with market structure.

Goldbach The Algo2 Buy and Sell Signal Tracker[Spec]Goldbach The Algo2 Buy and Sell Signal Tracker – Dual Range Confluence System
This indicator identifies high-probability buy and sell signals using a dual Goldbach range logic: 729 (macro) and 243 (micro). It filters for confluence moments when price behavior aligns across both ranges, delivering precise orange BUY or SELL signals based on engineered liquidity zones and structural levels.
This script does not use the yellow “Special” label. It focuses only on the confirmed orange BUY/SELL signals.
What Is Goldbach Logic in Trading?
Goldbach trading logic divides price into structured dealing ranges (such as 81, 243, or 729 points) and assigns fixed proportional levels within each range. These levels act as reaction zones, similar to Fibonacci, but based on consistent mathematical structure.
Key proportional levels:
0.03 – Rebalance Band (RB)
0.11 – Order Block (OB)
0.17 – Fair Value (FV)
0.50 – Equilibrium (EQ)
0.83 – Reverse FV
0.89 / 0.97 – OB and RB upper zones
These levels define where price is likely to react, reverse, or consolidate.
How the Spec Version Works
This indicator uses two Goldbach ranges at once:
729-point range (macro structure)
243-point range (micro structure)
A signal is only triggered when both ranges show aligned behavior using Algo2 logic — a confirmation method that increases the quality of each signal.
Signal Logic Summary
Buy Signal (Orange Label):
Price enters the discount zone (0.03–0.11)
Accumulation signs appear (wicks, pauses, rejections)
Price breaks above 0.17 (FV) = confirmation
Target zones: EQ (0.50) or upper levels (0.89–0.97)
Sell Signal (Orange Label):
Price reaches premium zone (0.89–0.97)
Distribution or trap behavior appears
Price breaks below 0.83 (reverse FV) = confirmation
Target zones: EQ (0.50) or lower levels (0.11–0.03)
Timeframes for Best Use
5M – 15M: Ideal for live execution during NY and London sessions
30M – 1H: Best for swing-level confirmation setups
1M – 3M: Advanced scalpers can use for micro confluence
Signals are rare but high quality — designed to filter noise and provide clean decision points.
How to Trade It
Watch for confirmed orange BUY/SELL labels
Use them as standalone entry points or confirmation tools
Combine with market session timing and structural analysis for improved accuracy
Backtest on trending assets such as NAS100, BTC, or major Forex pairs
Quick Summary
The Spec version of the Goldbach Algo2 Signal Tracker filters trades using a dual-range confluence model (729/243). Signals only appear when both macro and micro ranges agree, improving confidence and reducing noise. Ideal for traders who want fewer, more precise entries on structured ranges.

SETUP ALERTI made a indicator that give you a alert when there is a potential setup
it can be a pullback or reversal that can occur
the indicator only works on 5m
it gonna give you a little black dot above your screen if there is a potential setup, that little black dot doesn't gonna disturb your screen so much and it isn't biased like red or green signals
if go to other tfs than 5m you don't gonna see the black dot to, so only 5m
how i used it is when i got a setup i analyze where price comes from after i got that black dot plotted above my screen, if i see its a potential reversal poi where price comes from i am gonna look for a pullback on the ltfs to buy or sell to go with the trend
and if price didn't took a potential poi for a reversal i see as price took a trap/smt to make a pullback so i look for a setup where i can entry for the continuation after the pullback
more questions about it
@ycenti tg
pssss.... it works on all pairs we don't make differnce about it
just simple as it is!

CANX Enhanced Bill Williams FractalsBased on the well known Bill Williams Fractals but with some changes.
Smaller fractals with a more consistent intervals.
- Helps identify more recent and relevant swing points on the chart.
Ideal for identifying where to place a stop lose when you are trading subjectively.
- Great to implement into any mechanical strategy
Paired with CANX momentum indicator it can indicate very accurate times to enter a trade. Paired with the correct indicators or market structure these are a very powerful tool.
Keep it simple, keep it profitable!

ATS LOGIC CHART V5.0Main chart with a line graph, automatically identifying structure and trends, intelligently indicating LPS and LPSY as described by Wyckoff. Smart dynamic filter with price filtering mechanism.
主图折线,自动划分结构和走势,智能提示wykoff所表述的LPS,LPSY。智能动态滤网价格过滤机制.

TruePSPTruePSP – Precision Swing Points with True Opens
TruePSP is an advanced trading indicator that combines Precision Swing Point (PSP) candles with institutional reference levels known as True Opens, providing traders with a powerful lens to view price action through the eyes of Smart Money.
🔍 What is a PSP?
A PSP (Precision Swing Point) is a candle that forms when there's a crack in correlation between tightly linked indices—like NQ, ES, and YM. When one asset closes in a direction against the others, it reveals a potential displacement in sentiment, suggesting an early reversal or liquidity shift.
This makes PSPs:
Highly effective for anticipating market turning points
Strong confirmation tools for SMT/SSMT divergences
Useful in filtering low-probability setups
📐 Powered by True Opens
TruePSP integrates key True Open levels used by institutions to gauge premium vs. discount zones:
TSO – True Session Open
TDO – True Day Open
TWO – True Week Open
TMO – True Month Open
These levels help you:
Frame price in time-contextual zones
Identify where Smart Money is most likely active
Avoid chasing price in inefficient areas
⚙️ Features:
Detects PSPs through cross-asset correlation break logic
Plots True Opens to define trading bias zones
Enhances SMT/SSMT-based strategies
Useful across all timeframes
Designed for precision entries, exits, and bias
⚠️ To keep the PSP candle colors visible when other indicators overlap:
Right-click on the PSP candle
Select Visual Order
Click Send to Back
This will place the candle color beneath price and indicator overlays while still being visible on the chart.
TruePSP helps you trade with timing, structure, and confidence—where precision meets power.

Fractal Breakout Strategy (TP/SL/Trailing + Direction Filter)using fractals channel it gives buy and sell signals and we can trade accordingly

RunRox - Entry Model🎯 RunRox Entry Model is an all-in-one reversal-pattern indicator engineered to help traders accurately identify key price-reversal points on their charts. It will be part of our premium indicator package and improve the effectiveness of your trading strategies.
The primary concept of this indicator is liquidity analysis, making it ideal for Smart Money traders and for trading within market structure. At the same time, the indicator is universal and can be integrated into any strategy. Below, I will outline the full concept of the indicator and its settings so you can better understand how it works.
🧬 CONCEPT
In the screenshot below, I’ll schematically illustrate the core idea of this indicator. It’s one of the patterns that the indicator automatically detects on the chart using a two-timeframe approach. We use the higher timeframe to identify liquidity zones, and the lower timeframe to capture liquidity removal and structure breaks. The schematic is shown in the screenshot below.
Our indicator includes three entry models in total , and I will discuss its functionality and features in more detail later in this post.
💡 FEATURES
Three entry models
PO3 HTF Bar
Entry Area
Optimization for each Entry Area
Filters
HTF FVG
Alert customization
Next, we will examine each entry model in detail.
🟠 ENTRY MODEL 1
The first model is the core one we’ll work with; all other models rely on its structure and construction. In the screenshot below, I’ll schematically show the complete model.
As shown in the screenshot above, we display higher-timeframe candles on the current chart to better visualize the entry model and keep the trader informed of what’s happening on the larger timeframe. The screenshot also highlights both the Long and Short models, as well as the Entry Area, which I will explain in more detail below.
The schematic model on the lower timeframe is shown in the screenshot above. It illustrates that after the Entry Model forms, we draw the Entry Area on the next candle and wait for a price pullback into this zone for the optimal trade entry. Statistically, before moving higher, the price typically revisits the Entry Area, covering the imbalances created by MSS; thus, the Entry Area represents the ideal entry point.
🟩 Entry Area
Once the Entry Model has formed, we focus on identifying the optimal pullback zone for taking a position. To determine which retracement area performs best, we conducted extensive historical backtesting on potential zones and selected those that consistently delivered the strongest results. This process yields Entry Areas with the highest probability of a successful reversal.
On the screenshot above, you can see an example of the Entry Area and which zones carry a higher versus lower probability of reversal. Zones rendered with greater transparency have historically delivered weaker results than the more opaque zones. The deeper-colored areas represent the optimal entry zones and can improve your risk-reward ratio by allowing you to enter at more favorable prices.
It’s important to remember that the entire Entry Area functions as a potential zone for scaling into a position. However, if your risk-to-reward ratio isn’t favorable, you can wait for the price to retrace to lower levels within the Entry Area and enter with a more attractive risk-to-reward.
🟢 Pattern Rating
Each entry model receives a rating in the form of green circles next to its name 🟢. The rating ranges from one to four circles, based on the historical performance of similar patterns. To calculate this rating, we backtest past data by analyzing candle behavior during the model’s formation and assign circles according to how similar patterns performed historically.
Example Ratings:
🟢 – One circle
🟢🟢 – Two circles
🟢🟢🟢 – Three circles
🟢🟢🟢🟢 – Four circles
The more green circles a model has, the more reliable it is—but it’s crucial to rely on your own analysis when identifying strong reversal points on the chart. This rating reflects the model’s historical performance and does not guarantee future results, so keep that in mind!
Below is a screenshot showing four model variations with different ratings on the chart.
⚠️ Unconfirmed Pattern
Entry Model 1 is designed so that, until the higher-timeframe candle closes, the pattern remains unconfirmed and is hidden on the chart. For traders who prefer to see setups as they form, there’s a dedicated feature that displays the unconfirmed pattern at the moment of its appearance - triggered by the Market Structure Shift - before the HTF candle closes. The screenshot below shows what the pattern looks like prior to confirmation.
‼️IMPORTANT: Until the pattern is confirmed and the higher-timeframe candle has closed, the model may disappear from the chart if price reverses and the HTF candle closes below the previous bar. Therefore, this mode is suitable only for experienced traders who want to see market moves in advance. Remember that the pattern can be removed from the chart, so we recommend waiting for the HTF candle to close before deciding to enter a trade.‼️
✂️ Filters
For the primary model, there are four filters designed to enhance entry points or exclude less-confirmed patterns. The filters available in the indicator are:
Bounce Filter
Market Shift Mode
Same Wave Filter
Only with Divergence
I will explain how each of these filters works below.
- Bounce Filter
The Bounce Filter identifies significant deviations of price from its mean and only displays the Entry Model once the asset’s price moves beyond the average level. The screenshot below illustrates how this appears on the chart.
The actual average-price calculation is more sophisticated than what’s shown in the screenshot, that image is just an illustrative example. When the price deviates significantly from the N-bar average, we start looking for the Entry Model. This approach works particularly well in range-bound markets without a clear trend, as it lets you trade strong deviations from the mean.
- Market Shift Mode
This filter works by detecting the initial impulse that triggered the liquidity sweep on the previous higher-timeframe candle, and then holding the Market Structure Shift level at that point after the sweep. If the filter is turned off, price may move higher following the liquidity removal, creating a new MSS level and potentially producing a false structure shift and entry signal on the formed model.
This filter helps you more accurately identify genuine shifts - but keep in mind that the model can still perform well without it, so choose the setting that best suits your trading style.
- Same Wave Filter
The Same Wave Filter removes entry models that form without a clear lower-timeframe structure when liquidity is swept from the previous higher-timeframe candle. In other words, if the prior HTF candle and the current one belong to the same impulse wave - without any retracements on the LTF - the model is filtered out.
Keep in mind that this filter may also exclude patterns that could have produced positive results, so whether to enable it depends on your trading system.
- Only with Divergence
The Only with Divergence filter detects divergence between the lows of successive candles and indicators like RSI. When the low that swept liquidity diverges from the previous candle’s low, the indicator displays a “DIV” label. Although RSI is cited as an example, our divergence calculation is more advanced. This filter highlights patterns where low divergence signals genuine liquidity manipulation and a likely aggressive price reversal.
🌀 Model Settings
Trade Direction: Choose whether to display models for Long or Short trades.
Fractal: Select between automatic fractal detection—which adapts the lower-timeframe (LTF) and higher-timeframe (HTF) candles—or Custom.
Custom Fractal: When Custom is selected, manually specify the LTF and HTF timeframes used to detect the patterns.
History Pattern Limit: Set the maximum number of patterns to display on the chart to keep it clean and uncluttered.
🎨 Model Style
You can flexibly customize the model’s appearance by choosing your preferred line thickness, color, and the other settings we discussed above.
🔵 ENTRY MODEL 2
This model appears under specific conditions when Model 1 cannot form. It’s a price-reversal model constructed according to different rules than the first model. The screenshot below shows how it looks on the chart.
This model forms less frequently than Model 1 but delivers equally strong performance and is displayed as a position-entry zone.
Like the Entry Area in Entry Model 1, this zone is calculated automatically and highlights the best entry levels: areas that showed the strongest historical results are rendered in a brighter shade.
🎨 Model Style
You can flexibly customize the style of Entry Model 2 - its color, opacity, visibility, and the average price of the previous candle.
🟢 ENTRY MODEL 3
Entry Model 3 is a continuation pattern that only forms after Entry Model 1 has completed and delivered the necessary price move to trigger Model 3.
Below is a schematic illustration of how Model 3 is intended to work.
🎨 Model Style
As with the previous models, you can flexibly customize the style of this zone.
⬆️ HTF CANDLES
One of the standout features of this indicator is the ability to plot higher-timeframe (HTF) candles directly on your lower-timeframe (LTF) chart, giving you clear visualization of the entry models and insight into what’s unfolding on the larger timeframe.
You can fully customize the HTF candles - select their style, the number of bars displayed, and tweak various settings to match your personal trading style.
HTF FVG
Fair Value Gaps (FVGs) can also be drawn on the HTF candles themselves, enabling you to spot key liquidity or interest zones at a glance, without switching between timeframes.
Additionally, you can view all significant historical HTF highs and lows, with demarcation lines showing where each HTF candle begins and ends.
All these options let you tailor the HTF candle display on your chart and monitor multiple timeframes’ trends in a single view.
📶 INFO PANEL
Instrument: the market symbol on which the model is detected
Fractal Timeframes: the LTF and HTF fractal periods used to locate the pattern
HTF Candle Countdown: the time remaining until the higher-timeframe candle closes
Trade Direction: the direction (Long or Short) in which the model is searched for entry
🔔 ALERT CUSTOMIZATION
And, of course, you can configure any alerts you need. There are seven alert types available:
Confirmed Entry Model 1
Unconfirmed Entry Model 1
Confirmed Entry Model 2
Confirmed Entry Model 3
Entry Area 1 Trigger
Entry Area 2 Trigger
Entry Area 3 Trigger
You also get a custom macro field where you can enter any placeholders to fully personalize your alerts. Below are example macros you can use in that field.
{{event}} - Event name ('New M1')
{{direction}} - Trade direction ('Long', 'Short')
{{area_beg}} - Entry Area Price
{{area_end}} - Entry Area Price
{{exchange}} - Exchange ('Binance')
{{ticker}} - Ticker ('BTCUSD')
{{interval}} - Timeframe ('1s', '1', 'D')
{{htf}} - High timeframe ('15', '60', 'D')
{{open}}-{{close}}-{{high}}-{{low}} - Candle price values
{{htf_open}}-{{htf_close}}-{{htf_high}}-{{htf_low}} - Last confirmed HTF candle's price
{{volume}} - Candle volume
{{time}} - Candle open time in UTC timezone
{{timenow}} - Signal time in UTC timezone
{{syminfo.currency}} - 'USD' for BTCUSD pair
{{syminfo.basecurrency}} - 'BTC' for BTCUSD pair
✅ USAGE EXAMPLES
Now I’ll demonstrate several ways to apply this indicator across different trading strategies.
Primarily, it’s most effective within the Smart Money framework - where liquidity and manipulation are the core focus - so it integrates seamlessly into your SMC-based approach.
However, it can also be employed in other strategies, such as classic technical analysis or Elliott Wave, to capitalize on reversal points on the chart.
Example 1
The first example illustrates forming a downtrend using a Smart Money strategy. After the market structure shifts and the first BOS is broken, we begin looking for a short entry.
Once Entry Model 1 is established, a Fair Value Gap appears, which we use as our position-entry zone. The nearest target becomes the newly formed BOS level.
In this trade, it was crucial to wait for a strong downtrend to develop before hunting for entries. Therefore, we waited for the first BOS to break and entered the trade to ride the continuation of the downtrend down to the next BOS level.
Example 2
The next example illustrates a downtrend developing with a Fair Value Gap on the 1-hour timeframe. The FVG is also displayed directly on the HTF candles in the chart.
The pattern forms within the HTF Fair Value Gap, indicating that we can balance this inefficiency and ride the continuation of the downtrend.
The target can simply be a 1:2 or 1:3 risk–reward ratio, as in our case.
📌 CONCLUSION
These two examples illustrate how this indicator can be used to identify reversals or trend continuations. In truth, there are countless ways to incorporate this tool, and each trader can adapt the model to fit their own strategy.
Always remember to rely on your own analysis and only enter trades when you feel confident in them.

Current Fractal High/Low (Dynamic)
This indicator dynamically tracks the most recent confirmed Fractal High and Fractal Low across any timeframe using custom left/right bar configurations.
🔍 Key Features:
Detects Fractal Highs and Lows based on user-defined pivot settings.
Draws a green line and label ("FH") at the most recent Fractal High.
Draws a red line and label ("FL") at the most recent Fractal Low.
All lines extend from the confirmation bar to the current candle.
Automatically removes old lines and labels for a clean, uncluttered chart.
🛠️ Customizable Inputs:
Left & Right bars for pivot sensitivity
Line width for visibility
📌 Use Cases:
Identifying structure shifts
Recognizing key swing points
Supporting liquidity and breakout strategies
💡 Fractals are confirmed only after the full formation of the pattern (left and right bars). This ensures reliability over reactivity.
This script is designed for intraday to swing traders who want a reliable way to visualize market turning points with minimal noise.

LANZ Strategy 4.0🔷 LANZ Strategy 4.0 — Trend Impulse Detection with Risk Management
LANZ Strategy 4.0 is a multi-indicator trend strategy designed for short to medium-term trading on any asset or timeframe. It combines Parabolic SAR, Supertrend, ADX, and time zone highlighting to detect and confirm trend impulses, while managing entries with dynamic Stop Loss (SL) and Take Profit (TP) levels.
🧠 Core Components:
Parabolic SAR: Identifies short-term trend reversals.
Supertrend: Highlights trend continuation zones.
ADX Filter: Ensures trend strength by filtering entries when ADX exceeds a defined threshold.
Impulse Detection Logic: Detects and confirms movement impulses with a counter, only generating trade signals on confirmed sequences.
Risk Management: Calculates dynamic SL/TP with a default risk-reward ratio of 1:2, minimum SL of 4 pts, and maximum of 12 pts.
📊 Visual Features:
Trend lines from Supertrend and SAR.
Colored background zones for different sessions (Asia, NY).
Labels and lines for entry, SL, and TP.
Movement number labels help visualize impulse progression.
Alerts when a new impulse is confirmed.
⚙️ How It Works:
The strategy waits for a confirmed impulse (i.e., change in SAR + Supertrend + ADX filter).
Once a valid impulse is confirmed:
A trade signal (BUY/SELL) is shown.
SL and TP levels are calculated and drawn.
The script monitors live price to determine if SL or TP is hit.
Impulse counter advances to label movement progression.
🔔 Alerts:
You will receive an alert each time a new valid impulse is confirmed, indicating a potential trading opportunity.
📝 Notes:
Script is intended for discretionary or assisted trading, not automated execution.
Works best during active sessions with visible trend direction.
You can adjust ATR period, multiplier, SL padding, and impulse thresholds.
Credits:
Developed by LANZ combines established technical indicators and original impulse-count logic.

ETH to RTH Gap DetectorETH to RTH Gap Detector
What It Does
This indicator identifies and tracks custom-defined gaps that form between Extended Trading Hours (ETH) and Regular Trading Hours (RTH). Unlike traditional gap definitions, this indicator uses a specialized approach - defining up gaps as the space between previous session close high to current session initial balance low, and down gaps as the space from previous session close low to current session initial balance high. Each detected gap is monitored until it's touched by price.
Key Features
Detects custom-defined ETH-RTH gaps based on previous session close and current session initial balance
Automatically identifies both up gaps and down gaps
Visualizes gaps with color-coded boxes that extend until touched
Tracks when gaps are filled (when price touches the gap area)
Offers multiple display options for filled gaps (color change, border only, pattern, or delete)
Provides comprehensive statistics including total gaps, up/down ratio, and touched gap percentage
Includes customizable alert system for real-time gap filling notifications
Features toggle options for dashboard visibility and weekend sessions
Uses time-based box coordinates to avoid common TradingView drawing limitations
How To Use It
Configure Session Times : Set your preferred RTH hours and timezone (default 9:30-16:00 America/New York)
Set Initial Balance Period : Adjust the initial balance period (default 30 minutes) for gap detection sensitivity
Monitor Gap Formation : The indicator automatically detects gaps between the previous session close and current session IB
Watch For Gap Fills : Gaps change appearance or disappear when price touches them, based on your selected style
Check Statistics : View the dashboard to see total gaps, directional distribution, and touched percentage
Set Alerts : Enable alerts to receive notifications when gaps are filled
Settings Guide
RTH Settings : Configure the start/end times and timezone for Regular Trading Hours
Initial Balance Period : Controls how many minutes after market open to calculate the initial balance (1-240 minutes)
Display Settings : Toggle gap boxes, extension behavior, and dashboard visibility
Filled Box Style : Choose how filled gaps appear - Filled (color change), Border Only, Pattern, or Delete
Color Settings : Customize colors for up gaps, down gaps, and filled gaps
Alert Settings : Control when and how alerts are triggered for gap fills
Weekend Session Toggle : Option to include or exclude weekend trading sessions
Technical Details
The indicator uses time-based coordinates (xloc.bar_time) to prevent "bar index too far" errors
Gap boxes are intelligently limited to avoid TradingView's 500-bar drawing limitation
Box creation and fill detection use proper range intersection logic for accuracy
Session detection is handled using TradingView's session string format for reliability
Initial balance detection is precisely calculated based on time difference
Statistics calculations exclude zero-division scenarios for stability
This indicator works best on futures markets with extended and regular trading hours, especially indices (ES, NQ, RTY) and commodities. Performs well on timeframes from 1-minute to 1-hour.
What Makes It Different
Most gap indicators focus on traditional open-to-previous-close gaps, but this tool offers a specialized definition more relevant to ETH/RTH transitions. By using the initial balance period to define gap edges, it captures meaningful price discrepancies that often provide trading opportunities. The indicator combines sophisticated gap detection logic with clean visualization and comprehensive tracking statistics. The customizable fill styles and integrated alert system make it practical for both chart analysis and active trading scenarios.

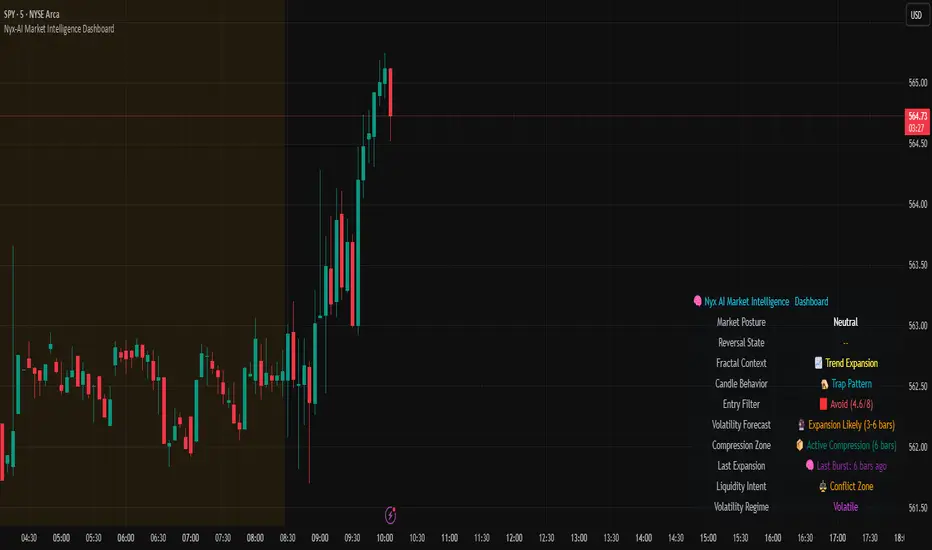
Nyx-AI Market Intelligence DashboardNyx AI Market Intelligence Dashboard is a non-signal-based environmental analysis tool that provides real-time insight into short-term market behavior. It is designed to help traders understand the quality of current price action, volume dynamics, volatility conditions, and structural behavior. It informs the trader whether the current market environment is supportive or hostile to trading and whether any active signal (from other tools) should be trusted, filtered, or avoided altogether.
Nyx is composed of seven intelligent modules. Each module operates independently but is visually unified through a floating dashboard panel on the chart. This panel renders live diagnostics every few bars, maintaining a low visual footprint without drawing overlays or modifying price.
Market Posture Engine
This module reads individual candlesticks using real-time candle anatomy to interpret directional bias and sentiment. It examines body-to-range ratio, wick imbalances, and compares them to prior bars. If the current candle is a large momentum body with minimal wick, it is interpreted as a directional thrust. If it is a small body with equal wicks, it is considered indecision. Engulfing patterns are used to detect potential liquidity tests. The system outputs a plain-text posture signal such as Building Bullish Intent, Bearish Momentum, Indecision Zone, Testing Liquidity (Up or Down), or Neutral.
Flow Reversal Engine
This module monitors short-term structural shifts and volume contraction to detect early signs of reversal or exhaustion. It looks for lower highs or higher lows paired with weakening volume and closing behavior that implies loss of momentum. It also monitors divergence between price and volume, as well as bar-to-bar momentum stalls (where highs and lows stop expanding). When these conditions are met, it outputs one of several states including Top Forming, Bottom Forming, Flow Divergence, Momentum Stall, or Neutral. This is useful for detecting inflection points before they manifest on trend indicators.
Fractal Context Engine
This engine compares the current bar’s range to its surrounding structural context. It uses a dynamic lookback length based on volatility. It determines whether the market is in expansion (strong directional trend), compression (shrinking range), or a transitional phase. A special case called Flip In Progress is triggered when the current high and low exceed the entire recent range, which often precedes sharp reversals or volatility expansion. The result is one of the following: Trend Expansion, Trend Breakdown, Sideways or Coil, Flip In Progress, or Expansion to Coil.
Candle Behavior Analyzer
This module analyzes the last five candles as a set to detect behavioral traits that a single candle may not reveal. It calculates average body and wick size, and counts how many recent candles show thrust (large body dominance), trap behavior (price returns inside wicks), or weakness (small bodies with high wick ratios). The module outputs one of the following behaviors: Aggressive Buying, Aggressive Selling, Trap Pattern, Trap During Coil, Low Participation, Low Energy, or Fakeout Candle. This helps the trader assess sentiment quality and the reliability of price movement.
Volatility Forecast and Compression Memory
This module predicts whether a breakout is likely based on recent compression behavior. It tracks how many of the last 10 bars had significantly reduced range compared to average. If a certain threshold is met without any recent large expansion bar, the system forecasts that a volatility expansion is likely in the near future. It also records how many bars ago the last high volatility impulse occurred and classifies whether current conditions are compressing. The outputs are Expansion Likely, Active Compression, and Last Burst memory, which provide breakout timing and energy insights.
Entry Filter
This module scores the current bar based on four adaptive criteria: body size relative to range, volume strength relative to average, current volatility versus historical volatility, and price position relative to a 20-period moving average. Each factor is scored as either 1 or 2. The total score is adjusted by a behavioral modifier that adds or subtracts a point if recent candles show aggression or trap behavior. Final scores range from 4 to 8 and are classified into Optimal, Mixed, or Avoid categories. This module is not a trade signal. It is a confluence filter that evaluates whether conditions are favorable for entry. It is particularly effective when layered with other indicators to improve precision.
Liquidity Intent Engine
This engine checks for price behavior around recent swing highs and lows. It uses adaptive pivots based on volatility to determine if price has swept above a recent high or below a recent low. This behavior is often associated with institutional liquidity hunts. If a sweep is detected and price has moved away from the sweep level, the engine infers directional intent and compares current distance to the high and low to determine which liquidity pool is more dominant. The output is Magnet Above, Magnet Below, or Conflict Zone. This is useful for anticipating directional bias driven by smart money activity.
Sticky Memory Tracking
To avoid flickering between states on low volatility or noisy price action, Nyx includes a sticky memory system. Each module’s output is preserved until a meaningful change is detected. For example, if Market Posture is Neutral and remains so for several bars, the previous non-neutral value is retained. This makes the dashboard more stable and easier to interpret without misleading noise.
Dashboard Rendering
All module outputs are displayed in a clean two-column panel anchored to any corner of the chart. Text values are color-coded, tooltips are added for context, and the data refreshes every few bars to maintain speed. The dashboard avoids clutter and blends seamlessly with other chart tools.
This tool is intended for informational and educational purposes only. It does not provide financial advice or trading signals. Nyx analyzes price, volume, structure, and volatility to offer context about the current market environment. It is not designed to predict future price movements or guarantee profitable outcomes. Traders should always use independent judgment and risk management. Past performance of any analysis logic does not guarantee future results.
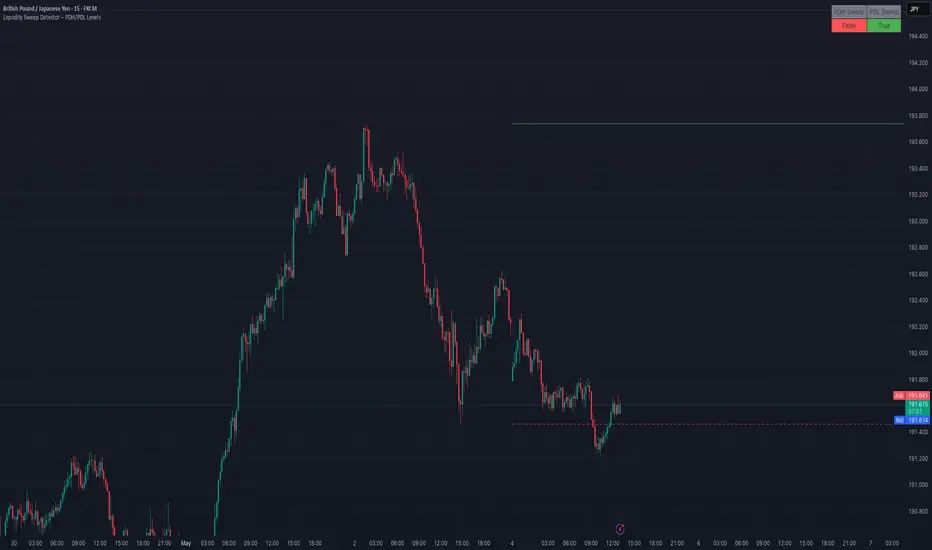
Liquidity Sweep Detector – PDH/PDL LevelsPrevious Day High/Low Liquidity Sweep Detector (Intraday Accurate)
This indicator tracks the previous day's high and low using intraday data, rather than the daily candle, ensuring precise sweep detection across lower timeframes (15m to 4H).
It monitors for liquidity sweeps—moments when price briefly moves above the previous high or below the previous low—and visually marks these events on the chart.
Key Features
Intraday-accurate PDH/PDL tracking
Real-time sweep detection
On-chart labels marking sweep events
Toggleable table showing sweep status
Alert conditions for PDH/PDL sweep triggers
Best For
Traders who use Smart Money Concepts (SMC), liquidity-based strategies, or look for stop hunts and reversal zones tied to key prior-day levels.
Works well across FX, crypto, and indices on 15m, 1H, and 4H charts.
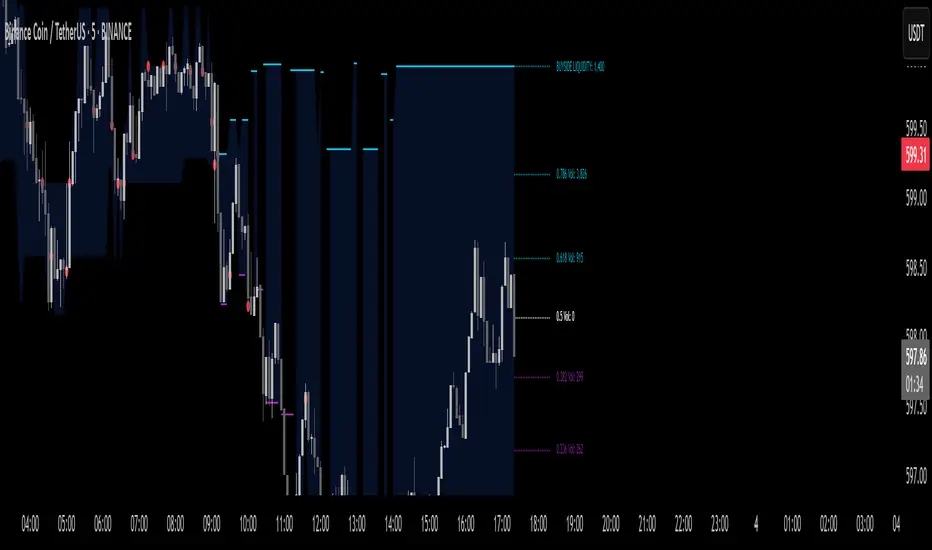
[Pandora's Chambers] Liquidity Grab Magnet Tool VDV_V6Pandora’s Chambers – Liquidity Grab Magnet Tool VDV_V6
The “Pandora’s Chambers – Liquidity Grab Magnet Tool VDV_V6” indicator is built as a mathematical function library in Pine Script® that identifies “magnet” points (local maxima) of price action density, based on a combination of frequency analysis (wick density) and Fibonacci values. The algorithm considers the distribution of wick touches within a lookback range, builds volume profiles at different price levels, and then marks the strongest dynamic support and resistance levels. This structure has been empirically proven to be particularly effective for rapid scalping, as these “magnet points” are characterized by strong market forces influencing sharp price movements.
Background and Methodology
Price Range Division into Bins: The range between the minimum and maximum price over the last N candles is divided into k equal bins.
Wick Touch Counting: For each bin, the number of times the bin center falls within the wick body of a candle is calculated.
Bullish and Bearish Candles:
For bullish candles (close > open), touches between the low and the open are counted.
For bearish candles (close < open), touches between the open and the high are counted.
Density Function: For each bin j, a density function ρ(j) = number of touches in j is obtained.
Strongest Levels: The strongest support level below the current price is arg max_{binCenter < close} ρ(j), and the resistance – above the price.
Integrated Volume Profile: For each bin, the trading volume of the candles where the bin center is included in the wick body is accumulated, adding a volume dimension to the selection of magnet points.
The Secret Algorithm
The algorithm utilizes several key constructs:
Dynamic Trailing with Sensitivity Threshold (trailTolerance): To avoid market noise, the line is redrawn only when the new point differs by Δ ≥ trailTolerance from the previous level.
Fibonacci Value Integration: After identifying support (sell-side) and resistance (buy-side) levels, Fibonacci lines are calculated at n ratios (0.0, 0.236, 0.382, 0.5, 0.618, 0.786, 1.0), with the option to extend them to additional "snap" values (1.618, 2.618). Each line also displays the corresponding trading volume in its paired bin, providing an indication of market depth at the Fibonacci point.
Visualization and Functionality:
Clear and Dynamic Colored Lines: Support is colored purple, resistance is colored cyan.
Transparent Labels: Displaying the actual volume value for each level.
“Magnet Point” Markers (red dots): Appearing upon the breakout of a line – enabling the identification of rapid scalping opportunities. Crossing of a line indicates the price "drinking liquidity." A red dot appears when the price reaches equilibrium.
Continued Liquidity: If the line moves away from the price, liquidity is expected to continue.
Key Parameters
Parameter Description
Lookback Bars Number of candles for historical analysis; size of the discrete dimension for density distribution.
Bin Count Number of bins for dividing the price range; determines the analysis resolution.
Tolerance Minimum threshold for a level change before a new line is created (to reduce noise).
Fibonacci Offsets Number of candles to the right to display Fibonacci lines with volume labels.
Show Liquidity Snap Toggle to display extended "snap" values outside the main range.
Line Width & Color Adjustable thickness, style, and color of support and resistance lines.
Label Size/Offset Adjustment of label text size and position – to prevent overlaps on the chart.
Export to Sheets
How to Use for Scalping
Identify the Magnet Point: Follow the red dot (•) the moment the price crosses a liquidity level downwards/upwards.
Parameter Adjustment: To increase sensitivity for scalping – reduce the Lookback or increase the Bin Count.
Market Depth Confirmation: Use the volume labels alongside the Fibonacci lines to confirm that the point is indeed accompanied by significant volume movement.
Mathematical Conclusion
The indicator combines statistical principles of density and historical memory with Fibonacci geometry, in a configuration that allows for the identification of reliable “magnet points.” For quantitative traders, this is a formal tool for drawing conclusions about market forces in the language of density functions and volume profiles, providing an ideal environment for rapid and precise scalps.
צור מחדש אבל תחליף את המילים סופורט וריסיסטנס לליקווידיטי
בטח, הנה הגרסה המחודשת של התיאור עם החלפת המילים "סופורט" ו"ריסיסטנס" ב"ליקווידיטי":
חדרי פנדורה – כלי מגנט ללכידת נזילות VDV_V6
האינדיקטור “חדרי פנדורה – כלי מגנט ללכידת נזילות VDV_V6” נבנה כספריית פונקציות מתמטית ב‑Pine Script® המזהה נקודות “מגנט” (מקסימום מקומי) של צפיפות תנועת המחיר, על בסיס שילוב של ניתוח תדרים (צפיפות וויקים) וערכי פיבונאצ’י. האלגוריתם מתייחס להתפלגות נגיעות הוויקים בתוך טווח הסתכלות (lookback), בונה פרופילי נפח במחיריים שונים, ולאחר מכן מסמן את רמות הנזילות הדינמיות החזקות ביותר. המבנה הוכח אמפירית כיעיל במיוחד לסקאלפינג מהיר, שכן “נקודות המגנט” מתאפיינות בכוחות שוק חזקים המשפיעים על תנועה חדה של המחיר.
רקע ומתודולוגיה
חלוקת טווח המחיר לבינים (bins): הטווח בין המחיר המינימלי למקסימלי ב־N הנרות האחרונים מחולק ל־k תאים שווים.
בכל תא מחשבים את מספר הפעמים שבהן מרכז התא נכנס לתוך גוף הוויק (wick) של הנר.
נרות בולשים ודובשים:
בנרות בולשים (close > open) נספרים מגעים בין ה־low ל־open.
בנרות דובשים (close < open) נספרים מגעים בין ה־open ל־high.
פונקציית צפיפות (Density Function): עבור כל תא j מתקבלת פונקציית צפיפות ρ(j) = מספר המגעים ב־j.
הרמה החזקה ביותר מתחת למחיר הנוכחי היא arg max_{binCenter < close} ρ(j), ולהתנגדות – מעל המחיר.
פרופיל נפח משולב (Volume Profile): לכל תא מצטבר נפח המסחר של הנרות שבהם מרכז התא נכלל בגוף הוויק, מה שמוסיף ממד נפחי לבחירת נקודות המגנט.
האלגוריתם הסודי
האלגוריתם עושה שימוש בכמה קונסטרוקטים עיקריים:
טריילינג דינמי עם סף רגישות (trailTolerance): כדי למנוע רעשי שוק, הקו ניזון מחדש רק כאשר הנקודה החדשה שונה ב־Δ ≥ trailTolerance מהרמה הקודמת.
שילוב ערכי פיבונאצ’י: לאחר זיהוי רמות נזילות (sell-side) ורמות נזילות (buy-side), מחושבים קווי פיבונאצ’י ב־n יחסיות (0.0, 0.236, 0.382, 0.5, 0.618, 0.786, 1.0), ואפשרות להרחבתם לערכי סנאפ נוספים (1.618, 2.618). כל קו מציג גם את נפח המסחר המתאים בתא התאום שלו, מה שנותן אינדיקציה לקריאות עומק השוק בנקודת פי
You stopped this response
Giv'atayim, Israel
צור מחדש אבל תחליף את המילים סופורט וריסיסטנס לליקווידיטי
באנגלית
Okay, here's the revised English description with "support" and "resistance" replaced by "liquidity":
Pandora’s Chambers – Liquidity Grab Magnet Tool VDV_V6
The “Pandora’s Chambers – Liquidity Grab Magnet Tool VDV_V6” indicator is built as a mathematical function library in Pine Script® that identifies “magnet” points (local maxima) of price action density, based on a combination of frequency analysis (wick density) and Fibonacci values. The algorithm considers the distribution of wick touches within a lookback range, builds volume profiles at different price levels, and then marks the strongest dynamic liquidity levels. This structure has been empirically proven to be particularly effective for rapid scalping, as these “magnet points” are characterized by strong market forces influencing sharp price movements.
Background and Methodology
Price Range Division into Bins: The range between the minimum and maximum price over the last N candles is divided into k equal bins.
Wick Touch Counting: For each bin, the number of times the bin center falls within the wick body of a candle is calculated.
Bullish and Bearish Candles:
For bullish candles (close > open), touches between the low and the open are counted.
For bearish candles (close < open), touches between the open and the high are counted.
Density Function: For each bin j, a density function ρ(j) = number of touches in j is obtained.
Strongest Levels: The strongest sell-side liquidity level below the current price is arg max_{binCenter < close} ρ(j), and the buy-side liquidity – above the price.
Integrated Volume Profile: For each bin, the trading volume of the candles where the bin center is included in the wick body is accumulated, adding a volume dimension to the selection of magnet points.
The Secret Algorithm
The algorithm utilizes several key constructs:
Dynamic Trailing with Sensitivity Threshold (trailTolerance): To avoid market noise, the line is redrawn only when the new point differs by Δ ≥ trailTolerance from the previous level.
Fibonacci Value Integration: After identifying sell-side liquidity and buy-side liquidity levels, Fibonacci lines are calculated at n ratios (0.0, 0.236, 0.382, 0.5, 0.618, 0.786, 1.0), with the option to extend them to additional "snap" values (1.618, 2.618). Each line also displays the corresponding trading volume in its paired bin, providing an indication of market depth at the Fibonacci point.
Visualization and Functionality:
Clear and Dynamic Colored Lines: Sell-side liquidity is colored purple, buy-side liquidity is colored cyan. Crossing of a line indicates the price "drinking liquidity."
Transparent Labels: Displaying the actual volume value for each level.
“Magnet Point” Markers (red dots): Appearing upon the breakout of a line – enabling the identification of rapid scalping opportunities. A red dot appears when the price reaches equilibrium. If the line moves away from the price, liquidity is expected to continue.
Key Parameters
Parameter Description
Lookback Bars Number of candles for historical analysis; size of the discrete dimension for density distribution.
Bin Count Number of bins for dividing the price range; determines the analysis resolution.
Tolerance Minimum threshold for a level change before a new line is created (to reduce noise).
Fibonacci Offsets Number of candles to the right to display Fibonacci lines with volume labels.
Show Liquidity Snap Toggle to display extended "snap" values outside the main range.
Line Width & Color Adjustable thickness, style, and color of liquidity lines.
Label Size/Offset Adjustment of label text size and position – to prevent overlaps on the chart.
Export to Sheets
How to Use for Scalping
Identify the Magnet Point: Follow the red dot (•) the moment the price crosses a liquidity level downwards/upwards.
Parameter Adjustment: To increase sensitivity for scalping – reduce the Lookback or increase the Bin Count.
Market Depth Confirmation: Use the volume labels alongside the Fibonacci lines to confirm that the point is indeed accompanied by significant volume movement.
Mathematical Conclusion
The indicator combines statistical principles of density and historical memory with Fibonacci geometry, in a configuration that allows for the identification of reliable “magnet points.” For quantitative traders, this is a formal tool for drawing conclusions about market forces in the language of density functions and volume profiles, providing an ideal environment for rapid and precise scalps.
BTC Markup/Markdown Zones by Koenigsegg📈 BTC Markup/Markdown Zones
A handcrafted indicator designed to mark Bitcoin's most critical High Time Frame (HTF) structure shifts. This tool overlays true institutional-level Markup and Markdown Zones, selected manually after deep market review. Whether you're testing strategies or actively trading, this tool gives you the bigger picture at all times.
🔍 Key Features:
✅ HTF Markup & Markdown Zones
Every zone is manually selected — no indicators, no repainting. Just raw market history and real structure.
✅ Two Display Modes
• Background Zones — soft overlays with low opacity for visual context — with the option to increase opacity manually if desired.
• Start Candle Highlight — sharply highlighted candle marking the final pivot before a macro reversal.
✅ Custom Color Controls (Style Tab)
All visual styling lives in the Style tab, with clearly labeled fields:
• Markup Zone
• Markdown Zone
• Start Candle Highlight Markup
• Start Candle Highlight Markdown
✅ Minimal Input Section
Just one toggle: display mode. Everything else is kept clean and intuitive.
🧠 Purpose:
This script is made for any timeframe:
• Zoom into lower timeframes to know whether you're trading inside a Markup or Markdown
• Use it during strategy testing for true structural awareness
📅 Handpicked Macro Turning Points:
Each zone originates from a manually confirmed candle — the last meaningful candle before a shift in control between bulls and bears:
• FRI 19 AUG 2011 12PM – MARK DOWN
• THU 20 OCT 2011 12AM – MARK UP
• WED 10 APR 2013 12PM – MARK DOWN
• FRI 12 APR 2013 12PM – MARK UP
• SAT 30 NOV 2013 12AM – MARK DOWN
• WED 14 JAN 2015 12PM – MARK UP
• SUN 17 DEC 2017 12PM – MARK DOWN
• SAT 15 DEC 2018 12PM – MARK UP
• WED 14 APR 2021 4AM – MARK DOWN
• TUE 22 JUN 2021 12PM – MARK UP
• WED 10 NOV 2021 12PM – MARK DOWN
• MON 21 NOV 2022 8PM – MARK UP
• THU 14 MAR 2024 4AM – MARK DOWN
• MON 5 AUG 2024 12PM – MARK UP
• MON 20 JAN 2025 4AM – MARK DOWN
💡 Zones are manually updated by me after each new confirmed Markup or Markdown.
🧬 Fractal Structure for MTF Systems
Price is fractal — meaning the same principles of structure repeat across all timeframes. In Version 2, this tool evolves by introducing manually selected sub-zones inside each High Time Frame (HTF) Markup or Markdown. These sub-zones reflect Medium Timeframe (MTF) structure shifts, offering precision for traders who operate on both intraday and swing levels.
This makes the indicator ideal for low timeframe (LTF) Markup/Markdown awareness — whether you're managing 15m entries or building multi-timeframe confluence systems.
No auto-zones. No guesswork. Just clean, intentional structure division within the broader trend, handpicked for maximum clarity and edge.
💡 Pro Tip:
When price is inside a Markup Zone, shorting becomes riskier — you're trading against a macro bullish structure.
When inside a Markdown Zone, longing becomes riskier — you're fighting against confirmed bearish momentum.
Use this tool to stay aligned with the broader move, especially when zoomed into smaller timeframes or managing entries/exits during intraday setups.
📈 Markup Phase – Bullish Sentiment
Definition: A period where price makes higher highs and higher lows — the uptrend is in full force.
Why sentiment is bullish:
- Institutions and smart money are already positioned long.
- Public/institutional demand drives prices up.
- Momentum is supported by positive news, breakouts, and FOMO.
- Higher highs confirm buyers are in control.
📉 Markdown Phase – Bearish Sentiment
Definition: A period where price makes lower lows and lower highs — clear downtrend.
Why sentiment is bearish:
- Distribution has already occurred, and supply outweighs demand.
- Smart money is short or sidelined, waiting for deeper prices.
- Panic selling or trend-following traders add downside momentum.
- Lower lows confirm sellers are in control.
❌ Trading Against the Trend — Consequences:
-Reduced Probability of Success
-You’re fighting the dominant flow. Most participants are pushing in the opposite direction.
-Drawdowns & Stop-Outs
-Countertrend trades often get wicked or flushed before any meaningful move, especially without structure-based entries.
-Low Risk-Reward Ratio
-Trends offer sustained moves. Countertrend trades may have small take-profit zones or chop.
-Mental Drain & Doubt
-Fighting momentum causes anxiety, second-guessing, and emotional reactions.
-Missed Opportunities
-Focusing on fighting the trend makes you blind to the high-probability setups with the trend.
-Increased Transaction Costs
-More stop-outs and re-entries mean more fees, more friction.
-FOMO from Watching the Trend Run
-Entering countertrend means you might watch the trend explode without you.
-Confirmation Bias & Stubbornness
-Countertrend traders often look for reasons to justify staying in the wrong direction — leading to bigger losses.
🧠 Summary
In markup = bulls dominate → you swim with the current.
In markdown = bears dominate → going long is like pushing a rock uphill.
Trading with the trend is not just safer, it's smarter. The edge lives in momentum — not ego.
⚠️ Disclaimer
This indicator is for educational and analytical use only. It is not financial advice and should not be relied on for decision-making without personal analysis.
This is not a predictive tool. No indicator can forecast upcoming price movements.
What you see here is based purely on past market behavior — specifically, historical tops and bottoms that marked the start of confirmed reversals.
This script does not know where the next reversal begins, nor can it determine where a new Markup or Markdown starts or ends. It is designed to provide context, not prediction.
Always trade with responsibility and perform your own due diligence.

Overnight ES Strategy: CBC + Fractal + RSI + ATR FilterThis script is designed for overnight trading of the E-mini S&P 500 futures (ES) between 6 PM and 11 PM EST.
It combines multiple technical confluences to generate high-probability buy and sell signals, focusing on volatility-rich, low-liquidity evening sessions.
Key Features:
Candle Body Confluence (CBC) Approximation:
Identifies candles with small real bodies compared to total range, simulating consolidation zones where price is likely to reverse.
Williams Fractal Confirmation:
Detects local tops and bottoms based on 5-bar fractal reversal patterns, helping validate breakout or reversal points.
RSI Filter:
Ensures momentum is supportive — buys only when RSI < 35 (oversold) and sells only when RSI > 65 (overbought).
ATR Volatility Filter:
Trades are only allowed if the Average True Range (ATR) exceeds a user-defined threshold, filtering out low-volatility, risky environments.
Time Session Control:
Signals are only generated during the user-defined evening session (default: 6 PM to 11 PM EST) to match market behavior.
Real-Time Alerts Enabled:
Alerts can be set for BUY or SELL conditions, enabling mobile notifications, emails, or pop-ups without constant chart monitoring.
Recommended Settings:
Chart Timeframe: 15-minute or 30-minute candles
Assets: ES Mini (ES1!), NQ Mini, or other CME futures
Session: New York Time (EST)
ATR Threshold: Adjust based on market conditions; 5.0 suggested starting point for ES Mini on 15m.
Important:
This script only plots signals, it does not auto-execute trades.
Always backtest and paper trade before using live capital.
Volatility can vary; consider adjusting RSI and ATR filters based on market environment.
Credits:
Script designed based on confluence of price action, momentum, reversal structure, and volatility filtering principles used by professional traders.
Inspired by Candle Body Confluence (CBC) theory and Williams fractal techniques.

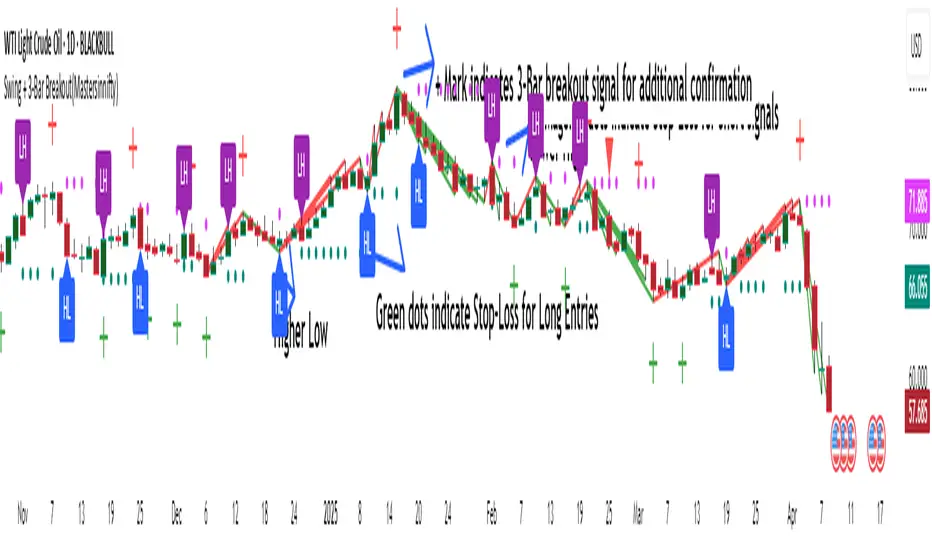
Swing + 3-Bar Breakout(Mastersinnifty)Overview
This script is a hybrid trading tool combining swing-based structural analysis, momentum filtering, and breakout validation — designed to detect early reversals and confirm trend continuations within a single unified system.
It integrates five major components:
- ZigZag Structural Detection — to identify critical swing highs and lows.
- Momentum Validation — using RSI and Rate of Change (ROC) to confirm the strength behind swings.
- Three-Bar Breakout Confirmation — spotting trend continuation beyond swing structures.
- Dynamic Trailing Stop System — managing trades adaptively via ATR-based trailing stops.
- Projected Target Levels — estimating future price destinations based on measured swings.
---
What Makes This Script Unique
Rather than using standard indicators in isolation, this script layers multiple conditions sequentially and contextually:
- Structural Foundation: Identifies pivots through a tight ZigZag algorithm tuned with a low-depth setting for early detection.
- Momentum Checkpoint: Validates pivots only if RSI extremes and ROC momentum surges align, reducing false breakouts during sideways movements.
- Breakout Validation: Confirms trend continuation when price breaches critical multi-bar highs/lows post-swing formation.
- Risk-Managed Progression: Initiates adaptive ATR-based trailing stops immediately after signal generation, tightening risk dynamically as trends unfold.
- Target Projection: Estimates potential move size by projecting the magnitude of the last completed swing, offering realistic price milestones.
This combination provides a dual-purpose tool for both reversals and breakouts, allowing flexible trading styles within a single indicator.
---
How the Script Works
- Swing Detection
- A swing low is identified when a price bottom forms (via ZigZag) and momentum conditions are met (RSI < 20, ROC > +0.5).
- A swing high is identified when a price top forms and momentum conditions are met (RSI > 80, ROC < -0.5).
- Breakout Confirmation
- After a swing is detected, if price crosses above/below a three-bar swing structure, a secondary breakout signal is triggered.
- Trailing Stop Activation:
- Upon a confirmed swing or breakout, an ATR-multiplied trailing stop is initialized below/above the entry point to secure profits dynamically.
- Projection Logic
- Swing height is measured from the latest high-low sequence, and potential future targets are plotted for visual guidance.
---
Who Can Benefit From This Indicator
- Swing Traders — who seek early entries around reversal zones.
- Scalpers & Intraday Traders — needing fast-reacting momentum-based confirmation.
- Breakout Traders — to time entries after multi-bar compressions.
- Risk Managers — through integrated ATR trailing stops for dynamic exit management.
- Price Action Analysts — utilizing projected swing targets for strategic planning.
---
How to Use
- Entry Identification
- Look for buy signals at swing lows with strong positive momentum.
- Look for sell signals at swing highs with strong negative momentum.
- Use breakout confirmations to validate the trend continuation beyond swings.
- Risk Management
- Monitor trailing stop lines to track trade health.
- Watch projected targets to anticipate realistic move completions.
- Chart Visibility
- All plotted points, breakout markers, trailing stops, and projected levels are generated automatically for clarity.
---
Disclaimer
This script is intended for educational and analytical purposes only.
It does not constitute financial advice, and past performance does not guarantee future results.
All trading involves risk. Users are responsible for their own trading decisions.
Timeframe Titans: Market Structure & MTF Order Blocks🟩 OVERVIEW
A combined market structure and order block indicator. Displays fractals, zigzags, Break Of Structure and Change Of Character lines. Shows order blocks on the chart and a higher timeframe.
Unique features include:
• The structure rules require counter fractals for BOS. This enables us to use more responsive fractal settings without creating excessive noise.
• Structure is strict. After the initial CHoCH there is always one and only one active CHoCH line.
• Order blocks can be filtered by market structure.
• Order blocks are based entirely on candle patterns (which appear to be unique among all the indicators we tested) instead of using pivots or other configurable calculations.
• Order blocks have separate mitigation levels, not merely the edge of the block, and being partially mitigated is a separate logical state.
🟩 WHAT IS MARKET STRUCTURE?
There are many ways to conceptualise and code market structure — the prevailing trend derived from important price levels. All of them start with identifying highs and lows in price, then use breaks of those levels to assign a trend.
This indicator displays the following market structure features:
• Williams Fractals to derive high and low pivots.
• Zigzag lines, which connect highs and lows.
• Break of Structure (BOS) lines, which are formed from the highest high in an *uptrend* or the lowest low in a *downtrend*. A break of a BOS line signals trend continuation.
• Change of Character (CHoCH) lines, which are formed from the highest high in a *downtrend* or the lowest low in an *uptrend*. A break of a CHoCH line signals trend reversal.
• Market structure bias, which is derived from the break of a CHoCH line. If a CHoCH line is broken to the upside, the trend is bullish, and if to the downside, bearish.
(For more details of the market structure features of this indicator, see the FEATURES OF THIS INDICATOR section.)
This definition of market structure implies that:
• There can only ever be one single active BOS line.
• There can only ever be one single active CHoCH line.
• A break of a BOS line creates a new CHoCH line.
• A break of a CHoCH line creates a new bias, a new BOS line, and a new CHoCH line.
• Before we can create a BOS, we need to know the bias, for which we need the CHoCH, for which we need BOS... just one of the chicken-vs-egg difficulties of coding market structure.
To understand how this indicator differs from other market structure indicators, see the COMPARISON WITH OTHER INDICATORS section.
🟩 WHAT ARE ORDER BLOCKS?
Order blocks are candle patterns that appear at highs and lows. The theory is that these areas are where many orders were filled — too many for the order book, causing an imbalance in buyers and sellers. As such, these areas can form support or resistance levels when price returns to them.
This indicator displays the following features related to order blocks:
• Imbalances, also called Fair Value Gaps.
• Order blocks of two different types (Imbalance Block and Standard Order Blocks)
(For more details of the order block features of this indicator, see the FEATURES OF THIS INDICATOR section.)
There are different patterns that can define order blocks, but the common element is that price should move vigorously away from the area after the pattern forms.
To understand how this indicator differs from other order block indicators, see the COMPARISON WITH OTHER INDICATORS section.
🟩 FEATURES OF THIS INDICATOR
Pivots
Shows Williams high and low fractals, with a configurable lookback. The pivots are always calculated, since they are the building block of all other market structure features. The pivot shape display can be turned on or off, and the display customised.
Zigzag
Draws lines between the highs and lows. The lines can be shown or hidden, and the colour and thickness configured.
Break of Structure
BOS lines are always calculated, but can be shown or hidden. The appearance can be customised. BOS lines are drawn from the candle that has the high or low that defines their level. They always extend until they are broken or the bias changes. The BOS lines have an optional, configurable label. When a BOS line is broken, an optional, configurable label is drawn on that bar.
Change of Character
CHoCH lines can be shown, hidden, and customised. CHoCH lines always extend until they are broken or a new CHoCH line is formed. CHoCH lines have optional labels. A different, customisable label is drawn when a CHoCH line is broken.
Market structure bias
Market structure bias is derived from the break of a CHoCH line. If a CHoCH line is broken to the upside, the trend is bullish, and if to the downside, bearish. The background is shaded a configurable colour based on the trend.
Imbalances
Imbalances are drawn in configurable colours. When they are mitigated, you can choose to change the colour, delete them, or leave them.
Order blocks
Two types of imbalance order blocks are displayed: Standard Order Blocks and Imbalance Blocks. They can be shown or hidden, and customised, independently.
Each order block has a mitigation line with configurable colours and style. If price exceeds the mitigation line, the order block is mitigated and is considered inactive.
The order blocks, or their labels, can be deleted when the order block is mitigated. If not deleted, their colour is changed and they no longer extend with each new bar.
Order blocks on the chart timeframe can be shown conditionally within the context of the market structure: you can choose to show:
• Pro-trend order blocks (bearish order blocks that were created in bearish market structure and vice-versa).
• Counter-trend order blocks (bearish order blocks that were created in bullish market structure and vice-versa).
• All order blocks.
Higher timeframe
Imbalances and order blocks can be independently shown and customised on a single higher timeframe. The HTF functions of this indicator do not repaint because they use confirmed data.
You can choose a custom, fixed higher timeframe, or an "Auto" mode where the script automatically chooses the higher timeframe based on the chart timeframe.
Script information messages
An optional table shows information about the script, including configuration problems, such as if a custom HTF is not actually higher than the chart timeframe.
🟩 HOW TO USE
There are very many ways to use market structure and order blocks in trading and we recommend you study extensively, and if possible get a trusted mentor.
Here is a random example we found on the recent GBPUSD chart. In the screenshot below, the left chart is at 30m and the right is at 5m. We've toggled various settings to make the chart clearer for demonstration purposes.
1 — We get a CHoCH break on the higher timeframe. So our bias (if we are trying to trade with the trend) is bearish. Now we look for some other confluence.
2 — Price revisits the top of the range and mitigates an imbalance block. It wicks the CHoCH (resetting it) but does not break it on close. The bearish market structure is thus preserved. For these reasons, we're thinking about a short, and we switch to the 5m chart on the right to find an entry. We've chosen a Custom HTF of 30m to match the left chart and we can see the mitigated HTF order block, marked "30m IB". We can see when price moves definitively out of the order block area to the downside.
3 — A bearish order block is formed and very quickly price comes back into it. We could enter a short here with a stop above the closest relevant fractal.
4 — Another bearish order block forms and price retests it. Another entry. Two previous 5m bullish order blocks at the bottom of the chart act as support. We could potentially close our short here.
5 — Another test of the same block, which was not mitigated the first time. Another potential short entry. As it happens, price makes a massive run lower here, such that we could trail our stop down one ATR above every single high fractal (marked out using manual rays and a public ATR indicator) for a good R:R, but that's not the point.
This is a made-up, retrofitted example with a fairly generic methodology. It's just to show how some of the features of this indicator could be used in trading:
• Market structure can give a bias. It can also mark interesting levels.
• Using multiple timeframes, while more complex, can level up your trading experience.
• Price trading back into order blocks can be a good R:R entry.
Your actual way of trading, your playbook of setups, your knowledge of your strengths and weakness as a trader, is your own.
🟩 LIMITATIONS
This indicator is intended for use on Forex markets, although order blocks and market structure do form on any reasonably liquid asset.
The HTF uses confirmed data, so you need to wait until the HTF bar is closed before the order block can form. Therefore it does not repaint, in the sense that people worry about repainting, of changing data in the past. We use the latest recommended method of fetching HTF data .
The market structure uses live chart data, so structure and order blocks that are created by conditions on an open realtime bar can appear and disappear as the current bar close changes. This is quite normal .
The Williams pivots are by definition only confirmed after a defined number of bars, and like everyone else we plot them offset into the past.
Similarly, we offset order blocks into the past so that they start on the candle that has the high or low that defines the order block, not the candle that created them. For HTF order blocks, we calculate the number of chart bars back assuming a 24-hour market, which gives accurate offsets only on Forex and other symbols that trade close to 24 hours each day.
🟩 COMPARISON WITH OTHER INDICATORS
There are a great number of market structure and order block indicators already published on TradingView. Since there are only a certain number of highs and lows on the chart from which to produce structure and order blocks, they all look somewhat similar. However, this indicator, written entirely from scratch without reference to the code of any other indicators, is unique and original in two kinds of ways: in patterns and in features.
PRECISE PATTERNS
We believe that edge in trading can be found in, amongst other things, precision in analysis. You can't truly trust your backtests if your system is not repeatable, and your system is repeatable only if its definitions are precise.
We trade with this indicator, and our students trade with it as well. Why did we spend months creating a new indicator instead of using one of the many existing ones, most of which are free and open source?
Because they are not quite how we wanted.
The indicator was created from our proprietary structure rules, which are based on the generally accepted understanding of market structure, with some specific tweaks.
To prepare this description (after the indicator is finished), we searched for "Market Structure", "CHoCH", and "SMC" and list below all popular (with over 3K boosts; excluding invite-only) indicators that show market structure with CHoCH (sometimes called MSS). We configured the settings to most closely match how our indicator works, added both indicators to the same chart, and looked for relevant differences.
The purpose of this section is not to try to say that this indicator is better than any other, but just that it is different. This difference is important for us and our students.
Indicator #1
As you can see, the indicator interpreted the first part of the chart as a downtrend, whereas ours interpreted it as an uptrend. The structure is completely different, because our Williams Fractal lookback is 2, and the minimum "Swing Points" value for Indicator #1 is 10. Although this indicator is deservedly popular, it isn't what we can use for the way we trade.
Indicator #2
Setting the "Zigzag Length" to 2 results in wildly different market structure, as shown below. For many fractals, this indicator does not place the zigzag at the highest high or lowest low, as ours does consistently. It does not highlight the trend in any way. It gives many Market Structure Breaks in a short period. Although it's again wildly popular, it doesn't match our way of encoding market structure.
Indicator #3
Again, setting the "Pivot lb" and "Pivot rb" inputs to 2 gives much too sensitive market structure. This is because this indicator does not require, as we do, a counter-fractal to form after a fractal in order to confirm a BOS. We believe that this rule gives less noisy structure while also being responsive. Most indicators attempt to compensate for this by having a much larger lookback period. While this does of course give fewer pivots and less noise, this is simply a different logic and gives different results. Note also that although this indicator correctly defines the first section of the chart as an uptrend, it does not draw a CHoCH line. As discussed above, our definition of market structure means that there should always be one and only one active CHoCH line, and we draw this at the earliest sensible opportunity.
Indicator #4
Again, the lack of any extra pivot confirmation logic means that this indicator creates different structure with the same lookback period. Also note the lack of initial CHoCH.
Indicator #5
The lowest lookback is 3, and so this indicator too gives very different structure.
Indicator #6
Of course, using a lookback of 2 gives different structure with this indicator too. For variety, here we show a lookback of 5, which is the lowest setting that returns significantly less noisy structure. You can see that the main CHoCH at the top of the chart is similar but not at the same place. Increasing the lookback does not ever result in a CHoCH at the same place, because the logic is simply different. When the lookback increases above 10, no CHoCH lines are drawn at the top at all.
Indicator #7
This indicator uses the highest/lowest price for the last 10 bars (fixed), along with some other bar conditions. You can see the resulting structure is quite different. Among other differences, it does not create a BOS at the top of the chart, even in an uptrend, and it does not create an opposing CHoCH when the existing CHoCH is broken.
Indicator #8
With "Custom" market structure and a length of 2, BOS and CHoCH lines are drawn by this indicator but in incongruous places.
Conclusion
Although we only illustrate the top few alternatives, we did check many, many others.
These market structure indicators may produce useful output, but their structure differs significantly from ours. We didn't even need to get into specific examples because the general approaches are so different. It is up to the user to decide which indicator, and which interpretation of market structure, best suits their needs.
ORDER BLOCKS
Continuing, we illustrate differences with the most popular order block indicators, trying to get them to match our order blocks. Note that some of these are also in the previous list as market structure indicators.
Order blocks are always formed at swings when price moves away with force, so they will be sort of the same across all the very many existing order block indicators. We are looking for precision and differentiation, as we did with market structure.
Indicator #1
This indicator does not have ability to display mitigated order blocks, only active ones. The order blocks do not match at all.
Indicator #2
With a period of 2, this indicator marks many of the same order blocks as ours. It doesn't extend the blocks, and doesn't mark them when mitigated. The logic for choosing the order block candle is also clearly different.
Indicator #3
Even with very sensitive settings, this indicator did not create as many order blocks as ours and they are quite different.
Indicator #4
Again you can see the logic for choosing candles and creating blocks is simply different. This indicator has inadequate protection against empty arrays, which causes runtime errors on charts with not much history (not a problem for Forex charts in general, but noticeable on the testing chart).
Indicator #5
We were unable to get the order blocks to extend with this indicator, although it should be possible. Anyway the blocks are wildly different.
Indicator #6
Even with the most sensitive settings, this indicator showed only one order block on our test chart.
Indicator #7
This indicator incorporates complex price action concepts. Nevertheless, the order blocks are very different indeed.
Indicator #8
This indicator forms quite different blocks to ours. It has several interesting settings including a choice of using the candle body or wick.
Indicator #9
We were not able to configure this indicator to produce the same order blocks as ours.
Indicator #10
On very sensitive settings, this indicator matches many of our order blocks, but at the same time many are different.
Conclusion
None of the indicators tested here (nor the many others we looked at previously) use the same logic as ours. The differences are so obvious that we don't have to call out individual blocks and analyse how they differ.
Fundamentally, other indicators seem to use variable precision for pivots in their order block detection calculations. Our order blocks are pure candle patterns with two different rulesets for Standard Order Blocks and Imbalance Order Blocks, and this logic does not change.
Note that our order blocks do not always automatically extend to the swing high or low, nor allow the user to choose the limit of the block, but use unique rules.
In summary, our indicator differs from other order block indicators in terms of fundamental detection logic, candle placement, boundary definition, mitigation levels, and logical states (see below).
UNIQUE COMBINATION OF FEATURES
In comparison to all other indicators we looked at, our indicator:
• Uses order blocks with three states: active, mitigated, and partially mitigated. Our mitigation lines for order blocks are rules-based. If price touches the mitigation line, the order block is considered fully mitigated. If price goes inside the order block but does not hit the mitigation line, it is only partially mitigated. These three states are visually distinguished.
• Has the most extensive visual customisation options of all those we looked at. We believe that being able to customise how you see indicator outputs is very important for reducing mental load while analysing and trading.
• Has a unique feature that combines market structure and order blocks, where the user can choose to show pro-trend order blocks (bullish blocks that are formed in bullish structure and vice-versa) or counter-trend blocks (bullish blocks that are formed in bearish structure and vice-versa).
• Approximates an initial trend bias very quickly, so we can start creatng BOS, CHoCH, etc.
• Requires a counter pivot to confirm a BOS line. This seemingly small logical step actually creates very different structure, as we saw in the comparison section.
• Uses a sophisticated array-based sorting mechanism to preserve the selected number of imbalances, use the rest of the TradingView box allowance for order blocks, and delete excess order block objects (not just drawings) in reverse historical order.
• Hides order block drawings if they are a configurable distance away from price. Magically redraws them if price moves closer.
• Includes an equivalent to the system "Calculated bars" setting for the high timeframe, to avoid unnecessary processing and improve performance.
🟩 CODING CONSIDERATIONS
This indicator consists of all original code written by @SimpleCryptoLife for Timeframe_Titans.
AI was used for the following purposes:
• Autocomplete
• Checking that bullish and bearish logic is parallel in a given function
• Querying the names and locations of variables hundreds of lines away when we forgot what they're called, like an expensive search-and-replace
• Help with debugging (it usually makes up elaborate and wrong ideas though)
It was not used to replace the coder's expertise and creativity, or to "vibe-code" some black-box functionality we didn't understand. We can recommend that you use AI the same way.
═════════════════════════════════════════════════════════════

Akkerman IMB + Targets IndicatorAkkerman IMB + Targets Indicator
The Akkerman IMB + Targets Indicator is a powerful tool for traders who use the Smart Money Concept (SMC) methodology for intraday trading. This indicator combines several key elements of technical analysis, such as IMB (Imbalance) zones, liquidity zones, and intraday targets, to help traders identify significant levels on the chart for potential entry and exit points.
Main Features of the Indicator:
IMB (Imbalance) Zones:
The indicator detects IMB zones (imbalances) on the chart, which are often significant for the market because these zones can signal unsupported price moves where the market may either retrace or continue the move.
Green box — indicates a bullish IMB, where the price moves downward but does not reach the previous "low" level.
Red box — indicates a bearish IMB, where the price moves upward but does not reach the previous "high" level.
Liquidity Zones:
The indicator automatically identifies liquidity zones, which are critical levels for potential retracements or breakouts. These zones are determined by equal highs and lows on the chart (where the price has made similar highs or lows).
Triangles or lines highlight levels where significant buy or sell orders might be gathered.
Intraday Target Lines:
The indicator generates targets for intraday trading based on support and resistance levels over the last 10 periods.
These target lines on the chart indicate potential entry or exit points based on the lowest and highest prices over the past 10 bars, which represent key points for trading within the current session.
Indicator Settings:
Show IMB: Toggle to show or hide IMB zones on the chart.
Show Liquidity Zones: Toggle to show or hide liquidity zones on the chart.
Show Targets (Intraday): Toggle to show or hide intraday target lines.
Max Targets (maxTargets): Set the maximum number of targets to display on the chart.
How to Use:
IMB Zones help identify potential retracement or breakout zones on the market. These zones are a critical part of Smart Money analysis, as markets often retrace to these areas after significant price moves.
Liquidity Zones provide clues about where large orders may be gathered, which could lead to a retracement or breakout.
Intraday Targets assist in identifying important levels for entering or exiting trades within the current session to take advantage of short-term price movements.
Important Notes:
This indicator works best on the 1-hour timeframe (H1) for more accurate and stable signals.
For maximum effectiveness, it is recommended to combine this indicator with other technical indicators and analysis methods.
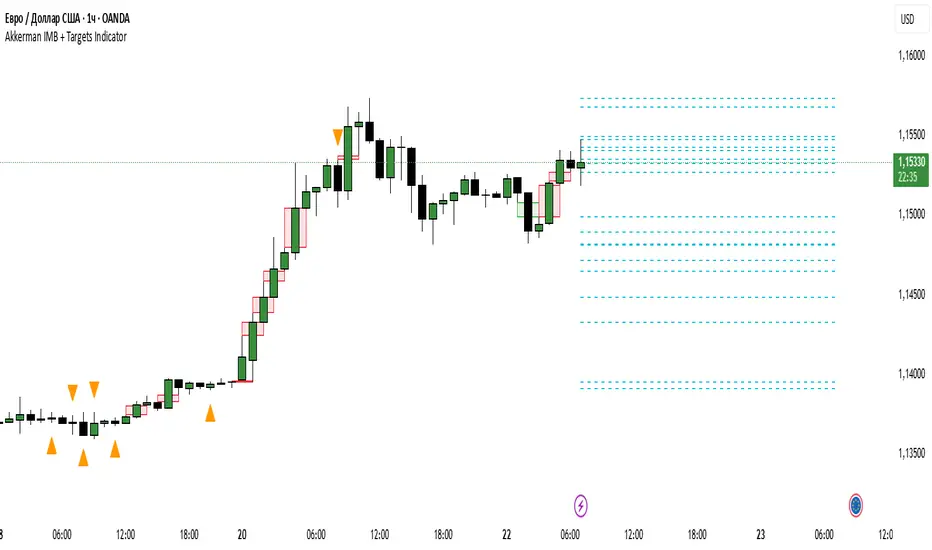
ENIGMA 369 ENIGMA 369 is a unique Pine Script indicator that combines two complementary trading systems: Break of Structure (BOS) Detection and Session-Based Sniper Signals.
Designed to help traders identify market structure shifts and potential intraday setups, it overlays on the chart to highlight key levels and momentum-driven opportunities. The indicator’s originality lies in its integration of pattern-based BOS analysis (inspired by Smart Money concepts) with time- and trend-filtered Sniper signals, creating a cohesive tool for both swing and intraday trading.
Unlike standalone breakout or scalping indicators, ENIGMA 369 uses:
BOS Logic: A specific two-candle pattern sequence to detect structural shifts, filtered by ATR for significance.
Sniper Logic: Momentum-based signals during high-volatility sessions, optionally aligned with EMA trends.
This synergy allows traders to assess market direction strategically (via BOS) and time entries tactically (via Sniper), all within one indicator.
What It Does
ENIGMA 369 performs two distinct functions:
Break of Structure (BOS) Detection:
Identifies potential support/resistance levels using BullBear (bullish candle followed by bearish) and BearBull (bearish followed by bullish) candle pairs.
Confirms breakouts when price sustains above (bullish) or below (bearish) these levels for a set number of bars.
Draws horizontal lines at confirmed breakout levels, which persist until price crosses a user-defined buffer zone.
Sniper Momentum Signals:
Detects buy/sell setups during user-specified trading sessions (e.g., London/US), based on candle momentum (close relative to midpoint, higher highs/lower lows).
Optionally filters signals with an EMA to align with the broader trend.
Plots lines at the candle’s high/low and 50% wick levels, serving as reference points for entries or stops, removed when price crosses them.
How It Works
ENIGMA 369 relies on price action, market timing, and trend context to generate signals. Here’s how each component operates:
BOS Logic:
Pattern Detection: Scans for two-candle patterns where the first candle is significant (size exceeds an ATR-based threshold) and the second opposes it. For example, a BullBear pair marks the first candle’s high as a potential resistance.
ATR Filter: Uses the Average True Range (default: 14 periods) to ensure the first candle’s range or body is substantial, reducing noise. Users can adjust the ATR multiplier (default: 0.5).
Confirmation: Requires price to close above/below the stored level for a user-defined number of bars (default: 1) to confirm a breakout.
Line Management: Plots green (bullish) or red (bearish) lines at confirmed levels, extending for a set number of bars (default: 10). Lines are deleted if price crosses a buffer (percentage of price or ATR-based, default: 0.1).
Visualization: Optionally highlights pattern candles with transparent green/red backgrounds.
Sniper Logic:
Momentum Signals: Identifies buy signals when a candle closes above its midpoint (high+low)/2 and has a lower low than the prior candle, indicating potential bullish momentum. Sell signals require a close below the midpoint and a higher high.
Session Filter: Limits signals to user-defined London/US session hours (default: 1-23 UTC, adjustable to specific hours like 7-11 UTC for London).
EMA Filter: Optionally uses a 50-period EMA (adjustable) to ensure buy signals occur in uptrends (rising EMA) and sell signals in downtrends (falling EMA).
Line Plotting: Draws blue lines for buy signals (at the low and 50% of the lower wick) and orange lines for sell signals (at the high and 50% of the upper wick). Lines extend right until price crosses them, managed via arrays for efficiency.
Dynamic Removal: Lines are automatically deleted when price breaches them, reflecting changing market conditions.
Why Combine BOS and Sniper?
The integration of BOS and Sniper logic is purposeful and synergistic:
BOS provides a strategic view by identifying structural shifts, helping traders understand the market’s directional bias (e.g., bullish after a confirmed high breakout).
Sniper offers tactical entry points within these trends, focusing on high-volatility sessions where momentum is likely to drive clear moves.
Together, they enable traders to align short-term trades with long-term structure, reducing the risk of trading against the trend. For example, a trader can wait for a bullish BOS confirmation before taking Sniper buy signals, enhancing setup reliability.
This combination is original because it merges Smart Money-inspired BOS detection with a session-based momentum system, a pairing not commonly found in single indicators. It avoids redundant mashups by ensuring each component serves a distinct yet complementary role.
How to Use It
Setup:
Apply ENIGMA 369 to a TradingView chart (Pine Script v5). The chart shown here uses a clean H1 candlestick setup to highlight BOS and Sniper outputs clearly.
Customize settings:
BOS:
ATR Period (default: 14), Min Candle Size (default: 0.5x ATR): Adjust for pattern sensitivity.
Confirmation Bars (default: 1): Set for faster/slower breakouts.
Buffer Type (Percentage/ATR), Buffer Zone Value (default: 0.1): Control line deletion.
Show Lines (default: true), Highlight Candle Pairs (default: false): Enable visuals.
Customize line colors (green/red) and width/length.
Sniper:
London/US Start/End Hours: Set to match your asset’s volatility (e.g., 7-11 UTC for London forex).
EMA Filter (default: true), EMA Period (default: 50): Enable for trend alignment.
Customize line styles (Solid/Dotted/Dashed) and colors (blue/orange) to distinguish from BOS.
Suggested timeframes: H1-H4 for BOS (swing trading), M5-M15 for Sniper (intraday).
Trading with BOS:
Monitor for green (bullish) or red (bearish) lines indicating confirmed breakouts.
Use lines as support/resistance:
Bullish BOS: Consider longs above the line, with stops below the line or buffer.
Bearish BOS: Consider shorts below the line, with stops above the line or buffer.
Line deletion signals a potential reversal or level invalidation.
Trading with Sniper:
Look for blue (buy) or orange (sell) lines during active sessions:
Buy: Enter long at the low or 50% wick line, with stops below the low and targets at resistance.
Sell: Enter short at the high or 50% wick line, with stops above the high and targets at support.
Use EMA filter to avoid counter-trend signals.
Lines disappear when crossed, indicating the setup’s completion or invalidation.
Alerts:
Set alerts for:
“Bullish/Bearish BOS Confirmed” for structural shifts.
“Sniper Buy/Sell Alert” for intraday setups.
Combine with volume, key levels, or news for confirmation.
Best Practices:
Use BOS to confirm trend direction before taking Sniper signals.
Test settings on your asset/timeframe via backtesting.
Apply stop-losses and risk-reward ratios (e.g., 1:2) for discipline.
The chart example shows BOS lines (green/red) and Sniper lines (blue/orange) on an H1 chart, ensuring clarity.
Underlying Concepts
Market Structure (BOS): Identifies turning points where supply/demand shifts, using two-candle patterns to mark significant levels, similar to order block concepts.
Momentum and Timing (Sniper): Targets entries during high-liquidity sessions, using candle midpoint and wick analysis to capture momentum-driven moves.
Trend Context: EMA ensures signals align with the market’s direction, reducing false positives.
Price Action: Both systems rely on raw price behavior, avoiding lagging oscillators for timely signals.
Limitations
BOS may lag in fast markets; reduce confirmation bars for scalping.
Sniper signals depend on session settings; ensure alignment with your asset’s volatility.
Multiple lines may clutter charts; adjust colors/styles for clarity.
Not a standalone system; combine with other analysis for best results.
Disclaimer
ENIGMA 369 is a tool to identify potential trading setups, not a guaranteed profit system. Past performance does not predict future results. Backtest thoroughly and use with proper risk management.
Conclusion
ENIGMA 369 offers a structured approach to trading by combining BOS’s structural insights with Sniper’s precise, session-based entries. Its unique integration makes it suitable for traders seeking to align strategic and tactical decisions. Customize it to your style, test it rigorously, and use it to enhance your market analysis.
