DUP V12B (tích hợp nến động lượng)DUP V12B - Dynamic Universal Points (Momentum Candles & 3-Tier Menu)
Authors: Đinh Ngọc Thạch
Version: 12B (DUP V12B)
Date: May 15, 2025 (Conceptual publication date based on script header)
Introduction
Welcome to DUP V12B, an advanced TradingView strategy meticulously crafted by Đinh Ngọc Thạch with AI assistance from Gemini. This version builds upon the robust foundation of DUP V11, introducing significant refinements to its core signal logic for bottoming/topping detection, adaptive thresholds, and a highly intuitive 3-Tier Menu System for unparalleled user customization.
A key innovation in V12B is the integration of Dynamic Momentum Candles, offering a unique visual perspective on price action relative to volatility channels. This, combined with a streamlined approach that removes the previous complex "Tier 2" system, focuses on delivering clearer, more actionable insights.
The DUP (Dynamic Universal Points) philosophy centers around identifying potential market turning points by analyzing market context, applying adaptive thresholds, and confirming signals through a consensus of technical indicators. Whether you're a novice trader or an experienced quantitative researcher, DUP V12B provides a flexible and powerful toolkit to explore market dynamics.
Disclaimer
Trading involves substantial risk of loss and is not suitable for every investor. The DUP V12B strategy is provided for educational and informational purposes only. It does not constitute financial advice or a recommendation to buy or sell any 1 financial instrument. All trading decisions are your sole responsibility. Past performance is not indicative of future results. Backtest thoroughly and use at your own risk.
1.
github.com
github.com
User Guide
Core Concepts
DUP Philosophy: DUP stands for Dynamic Universal Points. The strategy aims to identify potential market bottoms for buying opportunities (and tops for selling, primarily through "Peak Detection") by adapting its parameters and signal thresholds to the prevailing market conditions.
Market Regimes: The script categorizes the market (based on a reference Index like VNINDEX) into three regimes:
REGIME_DOWNTREND: The reference index is in a downtrend.
REGIME_BOTTOMING_RANGE: The reference index is in a consolidation/bottoming phase or not in a clear trend.
REGIME_UPTREND: The reference index is in an uptrend.
LBU (Laddered Buy-in Units): This system allows for scaling into positions. Instead of entering with the full intended capital at once, LBU enables multiple entries (up to 5, configurable) as the price potentially moves into more favorable zones, based on pre-defined or adaptive ratios of your total allocated capital for that specific symbol.
Peak Detection Sell: This is a prioritized selling logic. If enabled, the strategy will actively look for signs of a market top (e.g., RSI falling from overbought, bearish divergences) to exit positions, potentially overriding standard exit methods like Trailing Stops or Take Profits.
Adaptive Layer: The strategy can adjust its internal sensitivity and signal thresholds (e.g., minimum score required for a buy signal) based on the broader market context (trend and volatility). This helps the script to be more or less aggressive depending on market conditions.
Momentum Candles: A new visualization feature in V12B. When enabled, the script plots its own candles, colored based on their position within a chosen volatility channel (Bollinger Bands %B or Keltner Channels). To use this effectively, you MUST HIDE THE ORIGINAL CHART CANDLES via TradingView's main chart settings.
Operating Modes (Key Feature)
DUP V12B introduces a 3-Tier menu system to cater to different user needs. It's crucial to only adjust settings relevant to your selected Operation Mode.
MODE_BASIC (1. Basic - Đơn giản):
The simplest mode, designed for quick setup and ease of use.
Allows toggling main features on/off (e.g., enable simple adaptive mode, show buy/sell signals, choose basic buy signal types, select primary sell methods).
Ideal for beginners or users who prefer a less granular approach.
MODE_ADVANCED (2. Advanced - Nâng cao):
Offers more detailed control over the strategy's parameters.
Fine-tune buy signal components (RSI, Stoch, Volume, Candle, etc.), LBU settings (ratios, max entries), standard exit parameters (Stop Loss, Trailing Stop, Take Profit types and values), Peak Detection Sell logic, and the overall sensitivity of the Adaptive Layer.
Suitable for traders who want to tailor the strategy more closely to specific instruments or their trading style.
MODE_PREMIUM (3. Premium - Developer):
Provides complete control over all aspects of the strategy, including its core "brain."
Market Context Engine: Configure how the script analyzes the reference market index.
Adaptive Layer Deep Dive: Manually input market/volatility scores, blend scores, and fine-tune impact factors.
Scoring Logic (Buy/Sell): Adjust the base thresholds and weights for each individual buy/sell confirmation signal.
V17 Legacy Params (Research): Access to older dynamic parameter settings for research purposes.
Debug Options: Display detailed internal states for in-depth analysis.
This mode is intended for advanced users, quantitative researchers, or those who wish to deeply understand and experiment with the script's internal mechanics.
Key Input Sections Walkthrough
0. CHẾ ĐỘ HOẠT ĐỘNG (QUAN TRỌNG) (Operation Mode - IMPORTANT):
This is the first and most critical setting. Choose Basic, Advanced, or Premium. Your choice here determines which subsequent settings are active and relevant.
1. BASIC MODE SETTINGS: (Only active if MODE_BASIC is selected)
🧠 Bật Chế độ Bám theo Thị trường (Thích ứng Đơn giản)?: Enables/disables a simplified adaptive behavior.
📈 Hiện Tín hiệu Mua? / 📉 Hiện Tín hiệu Bán?: Toggles visibility of buy/sell signal shapes on the chart.
Buy Signal Sources:
Sử dụng Phân kỳ làm Tín hiệu Mua?: Use bullish divergence as a buy condition.
Sử dụng RSI/Stoch Quá bán?: Use oscillator (RSI/Stoch) crossover from oversold as a buy condition.
Sử dụng Nến & Volume?: Use strong bullish candles and volume spikes as buy conditions.
Sell Methods:
🔥 Ưu tiên Bán Dò Đỉnh?: If enabled, prioritizes peak detection signals for exits.
💧 Sử dụng Dừng lỗ Động (Trailing Stop)?: Enables trailing stop (effective if Peak Sell is off or not triggered).
🛡️ Sử dụng Dừng lỗ Cố định (Stop Loss)?: Enables a fixed initial stop loss.
2. ADVANCED MODE SETTINGS: (Active if MODE_ADVANCED or MODE_PREMIUM is selected. Basic mode uses defaults from these.)
2.1. Advanced - Buy Signals & Base Params:
EMA Dài hạn (Base): Length for the long-term Exponential Moving Average.
Loại Kênh Trigger: Choose "Keltner Channel" or "Bollinger Bands" as the primary trigger for buy zones.
KC/BB Parameters: Lengths, Multipliers/Standard Deviations (these are "Base" values, potentially adjusted by the adaptive layer if active in Premium).
Detailed Buy Confirmation Toggles: Enable/disable and configure parameters for RSI (Oversold, Divergence), Volume, Candle patterns, Stochastic (Oversold, Divergence), MACD crossover, OBV trend, and ADX weakness.
2.2. Advanced - LBU Settings:
Tổng Vốn Dự kiến (Cho mã này) & Đơn vị Tiền tệ: Your intended total capital for this specific trading instrument and its currency (used for calculating position size with strategy.cash).
Chế độ Giải ngân LBU:
"Fixed Ratio": Uses pre-defined fixed percentage steps for LBU.
"Adaptive Ratio": (Currently simplified in V12 - may use a fixed factor).
"Custom Ratio": Manually set the percentage of capital for each LBU entry (LBU 1% to LBU 5%).
Số Lần Mua Tối Đa (Bậc LBU): Maximum number of LBU entries (1 to 5).
Tỷ lệ LBU 1 (%) - Tỷ lệ LBU 5 (%): Custom percentages for each LBU step if "Custom Ratio" is selected.
Buffer Giá LBU (%): Allows buying on a new LBU step if the new low is not strictly lower than the previous buy's low, but within this buffer percentage. 0.0 requires a strictly lower low.
⛔ Chặn Mua khi vào Uptrend?: Prevents further LBU entries if the market regime shifts to REGIME_UPTREND.
2.3. Advanced - Standard Exit Settings (SL/TS/TP):
Stop Loss (SL):
🛡️ Bật Stop Loss Chuẩn?: Enable/disable standard stop loss.
Loại SL: "ATR" (based on Average True Range) or "Swing Low" (based on recent lowest lows).
Parameters for ATR (Length, Base Multiplier) and Swing Low (Lookback, Buffer ATR Multiplier).
Trailing Stop (TS):
💧 Bật Trailing Stop Chuẩn?: Enable/disable standard trailing stop.
Loại TS: "EMA Trail", "PSAR", "Chandelier Trail", "ATR Trail (SuperTrend)".
Base parameters for each TS type (e.g., EMA Length, PSAR Start/Inc/Max, Chandelier Period/Multiplier, ATR Trail Length/Multiplier).
Take Profit (TP):
🎯 Loại Chốt lời:
"Không dùng TP": Disables automatic take profit.
"TP Đa mức (ATR/RR/Kênh)": Calculates 1-3 TP levels based on ATR, Risk/Reward, or Channel Uppers.
"TP % Mục tiêu": Exits when a fixed profit percentage from the average entry price is reached.
% Lãi Mục tiêu: The target profit percentage if "TP % Mục tiêu" is chosen.
Settings for "TP Đa mức":
Bật Tính toán & Vẽ TP Đa mức?: Whether to calculate and display these levels (useful even if not auto-exiting).
Số Mức TP Đa mức: How many TP levels to calculate (1-3).
Cách Tính TP Đa mức: "KC/BB Upper", "ATR Offset", "Fixed RR".
Detailed parameters for each calculation method.
Tự động Thoát lệnh tại TP Đa mức?: If "TP Đa mức" is the chosen type, enable this to auto-exit.
Mức TP Đa mức Thoát lệnh: Which of the calculated TP levels (1, 2, or 3) will trigger an automatic exit.
2.4. Advanced - Peak Detection Sell Settings:
🔥 Ưu tiên Bán Dò Đỉnh?: Enables the Peak Sell mode.
Signal Sources: RSI Fall from Overbought (OB), Bearish Divergence (RSI or MACD source), Stochastic OB Cross. Includes parameters like thresholds, lookbacks.
Logic Kết hợp Đỉnh: "ANY" (any peak signal triggers) or "ALL" (all enabled peak signals must trigger).
2.5. Advanced - Adaptive Layer Control:
🧠 Bật Chế độ Thích ứng?: Enable/disable the adaptive adjustments for Advanced mode.
⚙️ Độ nhạy Thích ứng Tổng thể: Controls how strongly the adaptive layer influences thresholds (uses internal market scores in this mode).
3. PREMIUM (DEV) MODE SETTINGS: (Only active if MODE_PREMIUM is selected)
3.1. Premium - Market Context Engine: Configure the reference Index (HOSE:VNINDEX by default), EMA/RSI/ADX/BB lengths, and thresholds for defining market regimes and internal scores.
3.2. Premium - Adaptive Layer Deep Dive: Input manual market/volatility scores, choose the source for adaptive scores ("Manual", "Internal Assessment", "Blended"), adjust overall sensitivity, and fine-tune impact factors for trend, volatility, and breadth. Includes base parameters for trailing stops that can be adaptively modified.
3.3. Premium - Scoring Logic (Buy/Sell): Set base minimum scores for bottoming/topping and, critically, assign weights (w - ...) to each individual confirmation signal (e.g., w - RSI OS, w - Divergence). This determines how influential each signal is in the overall buy/sell consensus score. Option to Điều chỉnh Trọng số Tín hiệu theo Bối cảnh TT? (Adjust signal weights by market context).
3.4. Premium - V17 Legacy Params (Research): For research, enables older V17 dynamic parameter adjustments.
3.5. Premium - Debug Options: Show detailed debug information on the chart for market context, adaptive layer calculations, scoring, and signal states.
4. COMMON SETTINGS - Display & UI:
Toggles for showing/hiding Buy (▲) / Sell (▼) shapes, EMA line, Trigger Channel lines, SL/TS/TP lines.
Buy Label customization (background/text color, size, offset).
Tô màu Nến theo Tín hiệu?: Note: This is traditional bar coloring. For the new Momentum Candles, see section 5 and disable this if using Momentum Candles.
Dashboard settings: Show/hide, position, background/text color, and toggles for what information to display (Market Context, Scores, LBU status, Position, SL/TP distance, Exit Mode).
5. COMMON SETTINGS - Momentum Candle Viz: (New in V12B)
🕯️ Bật Tô màu Nến Động Lượng?: Enable this to use Momentum Candles. If enabled, you MUST HIDE THE ORIGINAL CHART CANDLES from TradingView's main chart style settings for the effect to be visible correctly.
MC - Nguồn Vị Trí Nến: Choose "Bollinger Bands (%B)" or "Keltner Channels" as the basis for candle coloring.
Parameters for the chosen indicator (BB Length/Mult or KC Length/Mult for momentum calculation).
MC - Màu Bắt đầu (Thấp) & MC - Màu Kết thúc (Cao): Gradient colors for the candle body.
MC - Màu Bấc Nến & MC - Độ Trong Suốt Thân (%): Wick color and body transparency.
6. COMMON SETTINGS - Alert Messages:
Templates for Buy, Stop Loss, Trailing Stop, Take Profit, and Peak Sell alerts. You can customize these using placeholders (see "Alerts" section below).
How to Use
Initial Setup: Add the DUP V12B script to your chart. The first and most important step is to select your desired ⚙️ Chọn Chế độ Hoạt động (Operation Mode).
Basic Mode Users:
Navigate to "1. BASIC MODE SETTINGS."
Toggle the main features on/off as per your preference (e.g., Bật Chế độ Bám theo Thị trường, choose buy signal sources, select sell methods).
Advanced Mode Users:
Navigate to "2. ADVANCED MODE SETTINGS."
Configure Buy Signals & Base Parameters (EMA, Trigger Channel, confirmation indicators).
Set up your LBU strategy (Total Capital, Ratios, Max Entries).
Define your Standard Exit rules (SL, TS, TP types and their specific parameters).
Configure Peak Detection Sell if you intend to use it.
Adjust Adaptive Layer sensitivity if desired.
Premium Mode Users:
Navigate to "3. PREMIUM (DEV) MODE SETTINGS."
Dive deep into the Market Context Engine, Adaptive Layer, Scoring Logic, etc. Exercise caution, as these settings significantly impact the strategy's core behavior.
Momentum Candles (All Modes):
If you enable 🕯️ Bật Tô màu Nến Động Lượng? in "5. COMMON SETTINGS - Momentum Candle Viz," remember to hide the main chart's candles. Right-click on the chart -> Settings -> Symbol -> Untick "Body", "Borders", "Wick". This will prevent visual overlap.
LBU (Laddered Buy-in Units):
The strategy will attempt to buy in multiple steps if LBU is configured for more than one entry.
Each buy signal (rawDupBuySignal) is a potential LBU entry. The actual entry depends on lbuCounter, price conditions (lowerPriceCondition), budget, and uptrend restrictions.
Your Tổng Vốn Dự kiến is divided according to the LBU ratios for each entry.
Exits:
The strategy has a clear exit hierarchy:
Stop Loss (Hard SL): Always has the highest priority.
Peak Sell Mode (If Active): If Ưu tiên Bán Dò Đỉnh? is enabled and a peak sell signal occurs, this will take precedence over standard TS/TP.
Standard Exits (If Peak Sell is Inactive or Not Triggered): Trailing Stop or Take Profit (either multi-level or target %).
Dashboard:
Enable the Dashboard in "4. COMMON SETTINGS - Display & UI" to get a real-time overview of the market regime, current buy/sell scores vs. thresholds, LBU status, active position details, and SL/TP distances.
Alerts
The DUP V12B strategy supports customizable alert messages using placeholders that get dynamically replaced with real-time values when an alert is triggered.
Placeholders: You can use placeholders like:
{{ticker}}: Trading symbol (e.g., BTCUSD)
{{exchange}}: Exchange name (e.g., NASDAQ)
{{price}}: Price at which the alert condition met.
{{plot_X}}: Value of a specific plot (e.g., {{plot_0}} for the first plot() output). More complex for strategy-specific info.
Strategy-Specific Placeholders (as defined in the script's alert message inputs):
{{lbu_info}}: Information about the LBU entry.
{{sl_level}}: Stop loss level.
{{tp_level}}: Take profit level.
{{bottom_score}}: Buy score.
{{ratio}}%: LBU ratio percentage.
{{ts_type}}: Type of trailing stop hit.
{{ts_level}}: Trailing stop level.
{{tp_num}}: Take profit level number (for multi-level TP).
{{top_score}}: Sell score for peak detection.
{{peak_reason}}: Reason for peak detection sell.
Setting up Alerts in TradingView:
Click the "Alert" icon (clock) in TradingView's right-hand toolbar or on the script's name on the chart.
Condition: Select "DUP V12B".
Choose the specific alert condition you want (e.g., "Buy", "Sell", or any custom alert setup via alertcondition() if you were to add them – though strategies typically use strategy.entry, strategy.exit, strategy.close_all which can trigger alerts). For strategies, you often select the script name and then the specific entry/exit condition provided by TradingView (e.g., "Order fills and alert function calls").
Trigger: "Once Per Bar Close" is generally recommended for strategies to avoid premature signals based on intra-bar price fluctuations.
Alert Actions: Choose how you want to be notified (Notify on app, Show pop-up, Send email, Webhook URL, etc.).
Message: You can use the default messages from the script's input settings or craft your own using the placeholders.
To use the script's dynamic messages for strategy alerts, you typically use {{strategy.order.alert_message}} in the TradingView alert message box if the strategy call (like strategy.entry) includes an alert_message parameter. Since this script defines alert templates in inputs but doesn't explicitly pass them to strategy.entry/order via alert_message parameter in the provided code, you'd manually copy your desired template from the script's input into the TradingView alert message box, replacing placeholders as needed for what TradingView offers natively for strategies.
Example Alert Message (manual setup in TradingView alert dialog for a buy):
{{ticker}} DUP V12 BUY | LBU: {{strategy.order.comment}} | Price: {{strategy.order.price}} | SL: CheckScript | TP: CheckScript
(Note: Accessing exact dynamic SL/TP levels directly in strategy.order.alert_message without them being part of the order comment or a dedicated alert variable can be tricky. Often, the comment field is used, or you set separate alerts for SL/TP breaches if possible.)
For strategy alerts, it's often best to rely on the "Order Fill" alerts and use the comment field of your strategy.entry or strategy.close_all calls to pass dynamic information, then reference {{strategy.order.comment}} in your alert message.
Backtesting and Optimization
Thorough Backtesting: Before trading live, extensively backtest DUP V12B on various financial instruments (stocks, forex, crypto, etc.) and timeframes.
Parameter Optimization:
Adjust LBU ratios, stop-loss percentages, take-profit targets, and indicator lengths based on the specific asset's volatility and your risk tolerance.
The Advanced and Premium modes offer many parameters to fine-tune. Start with Advanced before moving to Premium.
max_bars_back: The script requests 1000 bars of historical data (max_bars_back=1000). Ensure your chart has sufficient data for accurate calculations, especially for longer-term indicators.
Commission & Slippage: The script includes settings for commission_value (e.g., 0.15%) and slippage (in ticks). Adjust these to reflect your actual trading costs for more realistic backtest results.
Troubleshooting & Tips
No Signals/Lines:
Check "COMMON SETTINGS - Display & UI" to ensure shapes and lines are enabled.
Verify that the features you expect to see signals from are enabled in your chosen Operation Mode (Basic, Advanced, or Premium settings).
Momentum Candles Not Displaying Correctly: Ensure you have hidden the original chart candles from TradingView's main chart settings (Style -> untick Body, Borders, Wick).
Start Simple: Begin with Basic or Advanced mode to understand the fundamental behavior before venturing into the Premium settings.
Read Tooltips: Hover over the input settings in the script's configuration panel. Many options have tooltips (in Vietnamese in the original script, but their function is described here) explaining their purpose.
Dashboard is Your Friend: Keep an eye on the on-chart dashboard (if enabled) for a quick status check of the script's internal state.
Fundamental Analysis

SMC Strategy with RSISupport and Resistant Indicators using confirmations of SMC. Liquidity sweeps, FVG, Orderblocks, Choch/Bos.

PEAD strategy█ OVERVIEW
This strategy trades the classic post-earnings announcement drift (PEAD).
It goes long only when the market gaps up after a positive EPS surprise.
█ LOGIC
1 — Earnings filter — EPS surprise > epsSprThresh %
2 — Gap filter — first regular 5-minute bar gaps ≥ gapThresh % above yesterday’s close
3 — Timing — only the first qualifying gap within one trading day of the earnings bar
4 — Momentum filter — last perfDays trading-day performance is positive
5 — Risk management
• Fixed stop-loss: stopPct % below entry
• Trailing exit: price < Daily EMA( emaLen )
█ INPUTS
• Gap up threshold (%) — 1 (gap size for entry)
• EPS surprise threshold (%) — 5 (min positive surprise)
• Past price performance — 20 (look-back bars for trend check)
• Fixed stop-loss (%) — 8 (hard stop distance)
• Daily EMA length — 30 (trailing exit length)
Note — Back-tests fill on the second 5-minute bar (Pine limitation).
Live trading: enable calc_on_every_tick=true for first-tick entries.
────────────────────────────────────────────
█ 概要(日本語)
本ストラテジーは決算後の PEAD を狙い、
EPS サプライズがプラス かつ 寄付きギャップアップ が発生した銘柄をスイングで買い持ちします。
█ ロジック
1 — 決算フィルター — EPS サプライズ > epsSprThresh %
2 — ギャップフィルター — レギュラー時間最初の 5 分足が前日終値+ gapThresh %以上
3 — タイミング — 決算当日または翌営業日の最初のギャップのみエントリー
4 — モメンタムフィルター — 過去 perfDays 営業日の騰落率がプラス
5 — リスク管理
• 固定ストップ:エントリー − stopPct %
• 利確:終値が日足 EMA( emaLen ) を下抜け
█ 入力パラメータ
• Gap up threshold (%) — 1 (ギャップ条件)
• EPS surprise threshold (%) — 5 (EPS サプライズ最小値)
• Past price performance — 20 (パフォーマンス判定日数)
• Fixed stop-loss (%) — 8 (固定ストップ幅)
• Daily EMA length — 30 (利確用 EMA 期間)
注意 — Pine の仕様上、バックテストでは寄付き 5 分足の次バーで約定します。
実運用で寄付き成行に合わせたい場合は calc_on_every_tick=true を有効にしてください。
────
ご意見や質問があればお気軽にコメントください。
Happy trading!

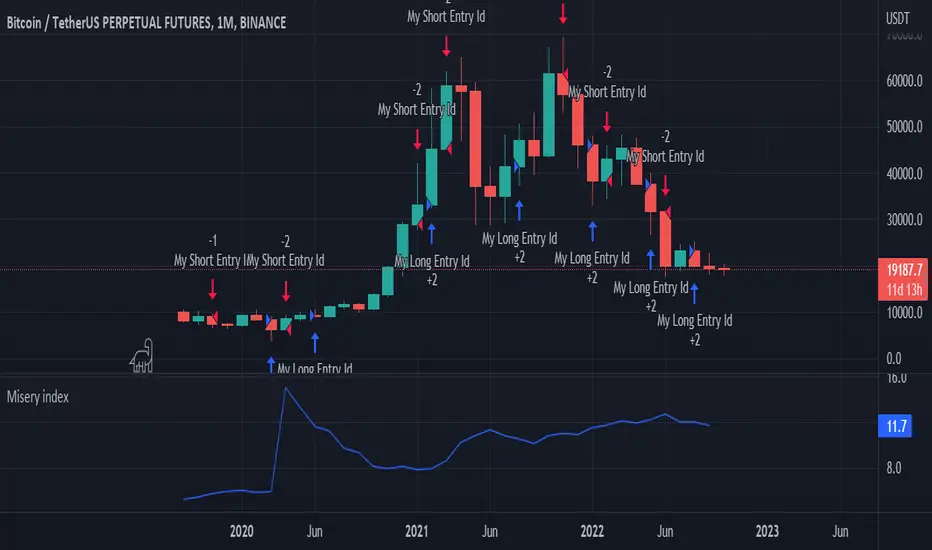
Misery index strategyHi all,
It's bear market so let's have a look at the misery index.
Misery index = inflation(%) + unemployment (%)
It's only possible to use this chart on the monthly (as misery index is updated monthly), but just for fun I added a strategy to it. If misery index increases you short and you go long when MI decreases.
Enjoy
p.s. the band is pretty cool too
Sharpe Ratio Forced Selling StrategyThis study introduces the “Sharpe Ratio Forced Selling Strategy”, a quantitative trading model that dynamically manages positions based on the rolling Sharpe Ratio of an asset’s excess returns relative to the risk-free rate. The Sharpe Ratio, first introduced by Sharpe (1966), remains a cornerstone in risk-adjusted performance measurement, capturing the trade-off between return and volatility. In this strategy, entries are triggered when the Sharpe Ratio falls below a specified low threshold (indicating excessive pessimism), and exits occur either when the Sharpe Ratio surpasses a high threshold (indicating optimism or mean reversion) or when a maximum holding period is reached.
The underlying economic intuition stems from institutional behavior. Institutional investors, such as pension funds and mutual funds, are often subject to risk management mandates and performance benchmarking, requiring them to reduce exposure to assets that exhibit deteriorating risk-adjusted returns over rolling periods (Greenwood and Scharfstein, 2013). When risk-adjusted performance improves, institutions may rebalance or liquidate positions to meet regulatory requirements or internal mandates, a behavior that can be proxied effectively through a rising Sharpe Ratio.
By systematically monitoring the Sharpe Ratio, the strategy anticipates when “forced selling” pressure is likely to abate, allowing for opportunistic entries into assets priced below fundamental value. Exits are equally mechanized, either triggered by Sharpe Ratio improvements or by a strict time-based constraint, acknowledging that institutional rebalancing and window-dressing activities are often time-bound (Coval and Stafford, 2007).
The Sharpe Ratio is particularly suitable for this framework due to its ability to standardize excess returns per unit of risk, ensuring comparability across timeframes and asset classes (Sharpe, 1994). Furthermore, adjusting returns by a dynamically updating short-term risk-free rate (e.g., US 3-Month T-Bills from FRED) ensures that macroeconomic conditions, such as shifting interest rates, are accurately incorporated into the risk assessment.
While the Sharpe Ratio is an efficient and widely recognized measure, the strategy could be enhanced by incorporating alternative or complementary risk metrics:
• Sortino Ratio: Unlike the Sharpe Ratio, the Sortino Ratio penalizes only downside volatility (Sortino and van der Meer, 1991). This would refine entries and exits to distinguish between “good” and “bad” volatility.
• Maximum Drawdown Constraints: Integrating a moving window maximum drawdown filter could prevent entries during persistent downtrends not captured by volatility alone.
• Conditional Value at Risk (CVaR): A measure of expected shortfall beyond the Value at Risk, CVaR could further constrain entry conditions by accounting for tail risk in extreme environments (Rockafellar and Uryasev, 2000).
• Dynamic Thresholds: Instead of static Sharpe thresholds, one could implement dynamic bands based on the historical distribution of the Sharpe Ratio, adjusting for volatility clustering effects (Cont, 2001).
Each of these risk parameters could be incorporated into the current script as additional input controls, further tailoring the model to different market regimes or investor risk appetites.
References
• Cont, R. (2001) ‘Empirical properties of asset returns: stylized facts and statistical issues’, Quantitative Finance, 1(2), pp. 223-236.
• Coval, J.D. and Stafford, E. (2007) ‘Asset Fire Sales (and Purchases) in Equity Markets’, Journal of Financial Economics, 86(2), pp. 479-512.
• Greenwood, R. and Scharfstein, D. (2013) ‘The Growth of Finance’, Journal of Economic Perspectives, 27(2), pp. 3-28.
• Rockafellar, R.T. and Uryasev, S. (2000) ‘Optimization of Conditional Value-at-Risk’, Journal of Risk, 2(3), pp. 21-41.
• Sharpe, W.F. (1966) ‘Mutual Fund Performance’, Journal of Business, 39(1), pp. 119-138.
• Sharpe, W.F. (1994) ‘The Sharpe Ratio’, Journal of Portfolio Management, 21(1), pp. 49-58.
• Sortino, F.A. and van der Meer, R. (1991) ‘Downside Risk’, Journal of Portfolio Management, 17(4), pp. 27-31.

Supertrend + MACD CrossoverKey Elements of the Template:
Supertrend Settings:
supertrendFactor: Adjustable to control the sensitivity of the Supertrend.
supertrendATRLength: ATR length used for Supertrend calculation.
MACD Settings:
macdFastLength, macdSlowLength, macdSignalSmoothing: These settings allow you to fine-tune the MACD for better results.
Risk Management:
Stop-Loss: The stop-loss is based on the ATR (Average True Range), a volatility-based indicator.
Take-Profit: The take-profit is based on the risk-reward ratio (set to 3x by default).
Both stop-loss and take-profit are dynamic, based on ATR, which adjusts according to market volatility.
Buy and Sell Signals:
Buy Signal: Supertrend is bullish, and MACD line crosses above the Signal line.
Sell Signal: Supertrend is bearish, and MACD line crosses below the Signal line.
Visual Elements:
The Supertrend line is plotted in green (bullish) and red (bearish).
Buy and Sell signals are shown with green and red triangles on the chart.
Next Steps for Optimization:
Backtesting:
Run backtests on BTC in the 5-minute timeframe and adjust parameters (Supertrend factor, MACD settings, risk-reward ratio) to find the optimal configuration for the 60% win ratio.
Fine-Tuning Parameters:
Adjust supertrendFactor and macdFastLength to find more optimal values based on BTC's market behavior.
Tweak the risk-reward ratio to maximize profitability while maintaining a good win ratio.
Evaluate Market Conditions:
The performance of the strategy can vary based on market volatility. It may be helpful to evaluate performance in different market conditions or pair it with a filter like RSI or volume.
Let me know if you'd like further tweaks or explanations!

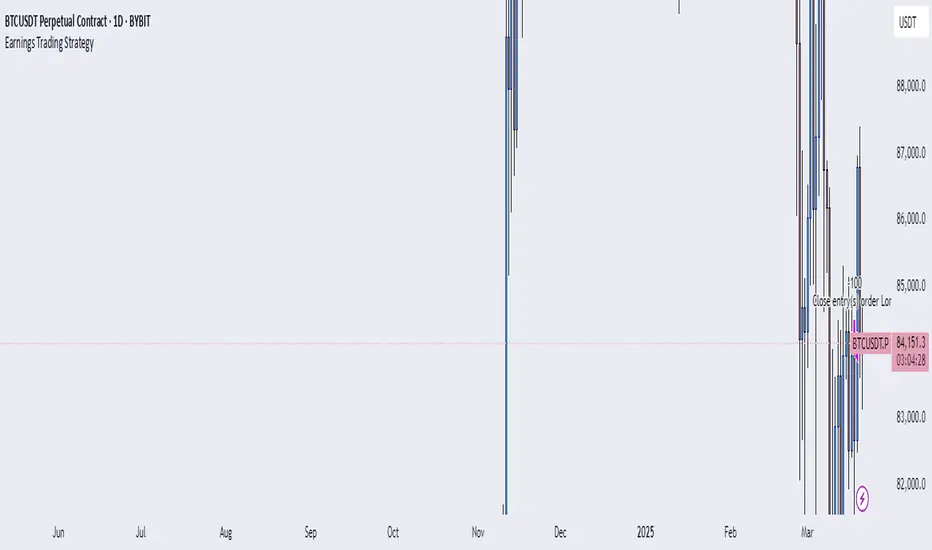
Earnings Trading StrategyThe Earnings Trade Strategy automates the process of entering and exiting trades based on earnings announcements for Apple (AAPL). It allows users to take a position—either long (buy) or short (sell short)—on the trading day before an earnings announcement and close that position on the trading day after the announcement. By leveraging TradingView’s Paper Trading environment, the strategy enables users to simulate trades and collect performance data over a 6-month period in a risk-free setting.
ICT Bread and Butter Sell-SetupICT Bread and Butter Sell-Setup – TradingView Strategy
Overview:
The ICT Bread and Butter Sell-Setup is an intraday trading strategy designed to capitalize on bearish market conditions. It follows institutional order flow and exploits liquidity patterns within key trading sessions—London, New York, and Asia—to identify high-probability short entries.
Key Components of the Strategy:
🔹 London Open Setup (2:00 AM – 8:20 AM NY Time)
The London session typically sets the initial directional move of the day.
A short-term high often forms before a downward push, establishing the daily high.
🔹 New York Open Kill Zone (8:20 AM – 10:00 AM NY Time)
The New York Judas Swing (a temporary rally above London’s high) creates an opportunity for short entries.
Traders fade this move, anticipating a sell-off targeting liquidity below previous lows.
🔹 London Close Buy Setup (10:30 AM – 1:00 PM NY Time)
If price reaches a higher timeframe discount array, a retracement higher is expected.
A bullish order block or failure swing signals a possible reversal.
The risk is set just below the day’s low, targeting a 20-30% retracement of the daily range.
🔹 Asia Open Sell Setup (7:00 PM – 2:00 AM NY Time)
If institutional order flow remains bearish, a short entry is taken around the 0-GMT Open.
Expect a 15-20 pip decline as the Asian range forms.
Strategy Rules:
📉 Short Entry Conditions:
✅ New York Judas Swing occurs (price moves above London’s high before reversing).
✅ Short entry is triggered when price closes below the open.
✅ Stop-loss is set 10 pips above the session high.
✅ Take-profit targets liquidity zones on higher timeframes.
📈 Long Entry (London Close Reversal):
✅ Price reaches a higher timeframe discount array between 10:30 AM – 1:00 PM NY Time.
✅ A bullish order block confirms the reversal.
✅ Stop-loss is set 10 pips below the day’s low.
✅ Take-profit targets 20-30% of the daily range retracement.
📉 Asia Open Sell Entry:
✅ Price trades slightly above the 0-GMT Open.
✅ Short entry is taken at resistance, targeting a quick 15-20 pip move.
Why Use This Strategy?
🚀 Institutional Order Flow Tracking – Aligns with smart money concepts.
📊 Precise Session Timing – Uses market structure across London, New York, and Asia.
🎯 High-Probability Entries – Focuses on liquidity grabs and engineered stop hunts.
📉 Optimized Risk Management – Defined stop-loss and take-profit levels.
This strategy is ideal for traders looking to trade with institutions, fade liquidity grabs, and capture high-probability short setups during the trading day. 📉🔥

RSI + Stochastic + WMA StrategyThis script is designed for TradingView and serves as a trading strategy (not just a visual indicator). It's intended for backtesting, strategy optimization, or live trading signal generation using a combination of popular technical indicators.
📊 Indicators Used in the Strategy:
Indicator Description
RSI (Relative Strength Index) Measures momentum; identifies overbought (>70) or oversold (<30) conditions.
Stochastic Oscillator (%K & %D) Detects momentum reversal points via crossovers. Useful for timing entries.
WMA (Weighted Moving Average) Identifies the trend direction (used as a trend filter).
📈 Trading Logic / Strategy Rules:
📌 Long Entry Condition (Buy Signal):
All 3 conditions must be true:
RSI is Oversold → RSI < 30
Stochastic Crossover Upward → %K crosses above %D
Price is above WMA → Confirms uptrend direction
👉 Interpretation: Market was oversold, momentum is turning up, and price confirms uptrend — bullish entry.
📌 Short Entry Condition (Sell Signal):
All 3 conditions must be true:
RSI is Overbought → RSI > 70
Stochastic Crossover Downward → %K crosses below %D
Price is below WMA → Confirms downtrend direction
👉 Interpretation: Market is overbought, momentum is turning down, and price confirms downtrend — bearish entry.
🔄 Strategy Execution (Backtesting Logic):
The script uses:
pinescript
Copy
Edit
strategy.entry("LONG", strategy.long)
strategy.entry("SHORT", strategy.short)
These are Pine Script functions to place buy and sell orders automatically when the above conditions are met. This allows you to:
Backtest the strategy
Measure win/loss ratio, drawdown, and profitability
Optimize indicator settings using TradingView Strategy Tester
📊 Visual Aids (Charts):
Plots WMA Line: Orange line for trend direction
Overbought/Oversold Zones: Horizontal lines at 70 (red) and 30 (green) for RSI visualization
⚡ Strategy Type Summary:
Category Setting
Strategy Type Momentum Reversal + Trend Filter
Timeframe Flexible (Works best on 1H, 4H, Daily)
Trading Style Swing/Intraday
Risk Profile Medium to High (due to momentum triggers)
Uses Leverage Possible (adjust risk accordingly)

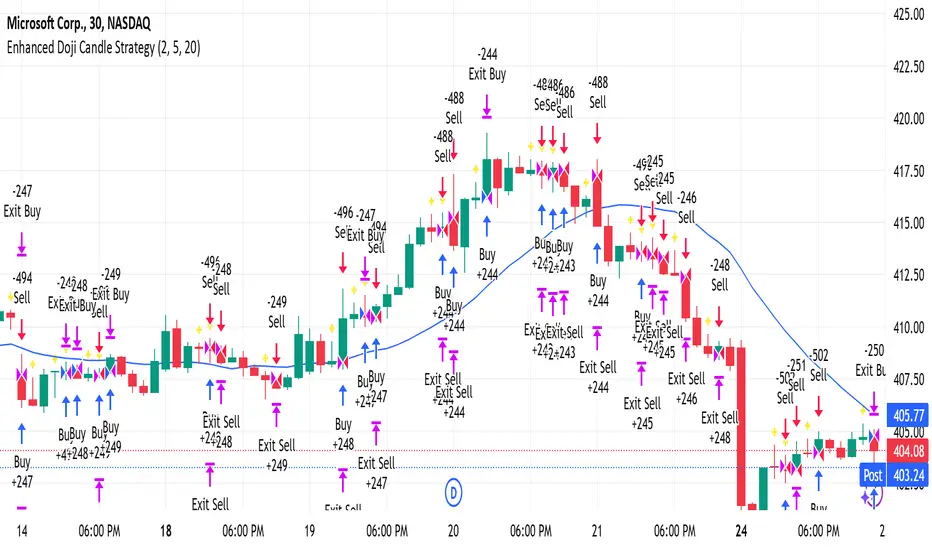
Enhanced Doji Candle StrategyYour trading strategy is a Doji Candlestick Reversal Strategy designed to identify potential market reversals using Doji candlestick patterns. These candles indicate indecision in the market, and when detected, your strategy uses a Simple Moving Average (SMA) with a short period of 20 to confirm the overall market trend. If the price is above the SMA, the trend is considered bullish; if it's below, the trend is bearish.
Once a Doji is detected, the strategy waits for one or two consecutive confirmation candles that align with the market trend. For a bullish confirmation, the candles must close higher than their opening price without significant bottom wicks. Conversely, for a bearish confirmation, the candles must close lower without noticeable top wicks. When these conditions are met, a trade is entered at the market price.
The risk management aspect of your strategy is clearly defined. A stop loss is automatically placed at the nearest recent swing high or low, with a tighter distance of 5 pips to allow for more trading opportunities. A take-profit level is set using a 2:1 reward-to-risk ratio, meaning the potential reward is twice the size of the risk on each trade.
Additionally, the strategy incorporates an early exit mechanism. If a reversal Doji forms in the opposite direction of your trade, the position is closed immediately to minimize losses. This strategy has been optimized to increase trade frequency by loosening the strictness of Doji detection and confirmation conditions while still maintaining sound risk management principles.
The strategy is coded in Pine Script for use on TradingView and uses built-in indicators like the SMA for trend detection. You also have flexible parameters to adjust risk levels, take-profit targets, and stop-loss placements, allowing you to tailor the strategy to different market conditions.
SPY/TLT Strategy█ STRATEGY OVERVIEW
The "SPY/TLT Strategy" is a trend-following crossover strategy designed to trade the relationship between TLT and its Simple Moving Average (SMA). The default configuration uses TLT (iShares 20+ Year Treasury Bond ETF) with a 20-period SMA, entering long positions on bullish crossovers and exiting on bearish crossunders. **This strategy is NOT optimized and performs best in trending markets.**
█ KEY FEATURES
SMA Crossover System: Uses price/SMA relationship for signal generation (Default: 20-period)
Dynamic Time Window: Configurable backtesting period (Default: 2014-2099)
Equity-Based Position Sizing: Default 100% equity allocation per trade
Real-Time Visual Feedback: Price/SMA plot with trend-state background coloring
Event-Driven Execution: Processes orders at bar close for accurate backtesting
█ SIGNAL GENERATION
1. LONG ENTRY CONDITION
TLT closing price crosses ABOVE SMA
Occurs within specified time window
Generates market order at next bar open
2. EXIT CONDITION
TLT closing price crosses BELOW SMA
Closes all open positions immediately
█ ADDITIONAL SETTINGS
SMA Period: Simple Moving Average length (Default: 20)
Start Time and End Time: The time window for trade execution (Default: 1 Jan 2014 - 1 Jan 2099)
Security Symbol: Ticker for analysis (Default: TLT)
█ PERFORMANCE OVERVIEW
Ideal Market Conditions: Strong trending environments
Potential Drawbacks: Whipsaws in range-bound markets
Backtesting results should be analyzed to optimize the MA Period and EMA Filter settings for specific instruments

Fibonacci Levels Strategy with High/Low Criteria-AYNETThis code represents a TradingView strategy that uses Fibonacci levels in conjunction with high/low price criteria over specified lookback periods to determine buy (long) and sell (short) conditions. Below is an explanation of each main part of the code:
Explanation of Key Sections
User Inputs for Higher Time Frame and Candle Settings
Users can select a higher time frame (timeframe) for analysis and specify whether to use the "Current" or "Last" higher time frame (HTF) candle for calculating Fibonacci levels.
The currentlast setting allows flexibility between using real-time or the most recent closed higher time frame candle.
Lookback Periods for High/Low Criteria
Two lookback periods, lowestLookback and highestLookback, allow users to set the number of bars to consider when finding the lowest and highest prices, respectively.
This determines the criteria for entering trades based on how recent highs or lows compare to current prices.
Fibonacci Levels Configuration
Fibonacci levels (0%, 23.6%, 38.2%, 50%, 61.8%, 78.6%, and 100%) are configurable. These are used to calculate price levels between the high and low of the higher time frame candle.
Each level represents a retracement or extension relative to the high/low range of the HTF candle, providing important price levels for decision-making.
HTF Candle Calculation
HTF candle data is calculated based on the higher time frame selected by the user, using the newbar check to reset htfhigh, htflow, and htfopen values.
The values are updated with each new HTF bar or as prices move within the same HTF bar to track the highest high and lowest low accurately.
Set Fibonacci Levels Array
Using the calculated HTF candle's high, low, and open, the Fibonacci levels are computed by interpolating these values according to the user-defined Fibonacci levels.
A fibLevels array stores these computed values.
Plotting Fibonacci Levels
Each Fibonacci level is plotted on the chart with a different color, providing visual indicators for potential support/resistance levels.
High/Low Price Criteria Calculation
The lowest and highest prices over the specified lookback periods (lowestLookback and highestLookback) are calculated and plotted on the chart. These serve as dynamic levels to trigger long or short entries.
Trade Signal Conditions
longCondition: A long (buy) signal is generated when the price crosses above both the lowest price criteria and the 50% Fibonacci level.
shortCondition: A short (sell) signal is generated when the price crosses below both the highest price criteria and the 50% Fibonacci level.
Executing Trades
Based on the longCondition and shortCondition, trades are entered with the strategy.entry() function, using the labels "Long" and "Short" for tracking on the chart.
Strategy Use
This strategy allows traders to utilize Fibonacci retracement levels and recent highs/lows to identify trend continuation or reversal points, potentially providing entry points aligned with larger market structure. Adjusting the lowestLookback and highestLookback along with Fibonacci levels enables a customizable approach to suit different trading styles and market conditions.

Bullish B's - RSI Divergence StrategyThis indicator strategy is an RSI (Relative Strength Index) divergence trading tool designed to identify high-probability entry and exit points based on trend shifts. It utilizes both regular and hidden RSI divergence patterns to spot potential reversals, with signals for both bullish and bearish conditions.
Key Features
Divergence Detection:
Bullish Divergence: Signals when RSI indicates momentum strengthening at a lower price level, suggesting a reversal to the upside.
Bearish Divergence: Signals when RSI shows weakening momentum at a higher price level, indicating a potential downside reversal.
Hidden Divergences: Looks for hidden bullish and bearish divergences, which signal trend continuation points where price action aligns with the prevailing trend.
Volume-Adjusted Entry Signals:
The strategy enters long trades when RSI shows bullish or hidden bullish divergence, indicating an upward momentum shift.
An optional volume filter ensures that only high-volume, high-conviction trades trigger a signal.
Exit Signals:
Exits long positions when RSI reaches a customizable overbought level, typically indicating a potential reversal or profit-taking opportunity.
Also closes positions if bearish divergence signals appear after a bullish setup, providing protection against trend reversals.
Trailing Stop-Loss:
Uses a trailing stop mechanism based on ATR (Average True Range) or a percentage threshold to lock in profits as the price moves in favor of the trade.
Alerts and Custom Notifications:
Integrated with TradingView alerts to notify the user when entry and exit conditions are met, supporting timely decision-making without constant monitoring.
Customizable Parameters:
Users can adjust the RSI period, pivot lookback range, overbought level, trailing stop type (ATR or percentage), and divergence range to fit their trading style.
Ideal Usage
This strategy is well-suited for trend traders and swing traders looking to capture reversals and trend continuations on medium to long timeframes. The divergence signals, paired with trailing stops and volume validation, make it adaptable for multiple asset classes, including stocks, forex, and crypto.
Summary
With its focus on RSI divergence, trailing stop-loss management, and volume filtering, this strategy aims to identify and capture trend changes with minimized risk. This allows traders to efficiently capture profitable moves and manage open positions with precision.
This Strategy BEST works with GLD!

ETH Signal 15m
This strategy uses the Supertrend indicator combined with RSI to generate buy and sell signals, with stop loss (SL) and take profit (TP) conditions based on ATR (Average True Range). Below is a detailed explanation of each part:
1. General Information BINANCE:ETHUSDT.P
Strategy Name: "ETH Signal 15m"
Designed for use on the 15-minute time frame for the ETH pair.
Default capital allocation is 15% of total equity for each trade.
2. Backtest Period
start_time and end_time: Define the start and end time of the backtest period.
start_time = 2024-08-01: Start date of the backtest.
end_time = 2054-01-01: End date of the backtest.
The strategy will only run when the current time falls within this specified range.
3. Supertrend Indicator
Supertrend is a trend-following indicator that provides buy or sell signals based on the direction of price changes.
factor = 2.76: The multiplier used in the Supertrend calculation (increasing this value makes the Supertrend less sensitive to price movements).
atrPeriod = 12: Number of periods used to calculate ATR.
Output:
direction: Determines the buy/sell direction based on Supertrend.
If direction decreases, it signals a buy (Long).
If direction increases, it signals a sell (Short).
4. RSI Indicator
RSI (Relative Strength Index) is a momentum indicator, often used to identify overbought or oversold conditions.
rsiLength = 12: Number of periods used to calculate RSI.
rsiOverbought = 70: RSI level considered overbought.
rsiOversold = 30: RSI level considered oversold.
5. Entry Conditions
Long Entry:
Supertrend gives a buy signal (ta.change(direction) < 0).
RSI must be below the overbought level (rsi < rsiOverbought).
Short Entry:
Supertrend gives a sell signal (ta.change(direction) > 0).
RSI must be above the oversold level (rsi > rsiOversold).
The strategy will only execute trades if the current time is within the backtest period (in_date_range).
6. Stop Loss (SL) and Take Profit (TP) Conditions
ATR (Average True Range) is used to calculate the distance for Stop Loss and Take Profit based on price volatility.
atr = ta.atr(atrPeriod): ATR is calculated using 12 periods.
Stop Loss and Take Profit are calculated as follows:
Long Trade:
Stop Loss: Set at close - 4 * atr (current price minus 4 times the ATR).
Take Profit: Set at close + 2 * atr (current price plus 2 times the ATR).
Short Trade:
Stop Loss: Set at close + 4 * atr (current price plus 4 times the ATR).
Take Profit: Set at close - 2.237 * atr (current price minus 2.237 times the ATR).
Summary:
This strategy enters a Long trade when the Supertrend indicates an upward trend and RSI is not in the overbought region. Conversely, a Short trade is entered when Supertrend signals a downtrend, and RSI is not oversold.
The trade is exited when the price reaches the Stop Loss or Take Profit levels, which are determined based on price volatility (ATR).
Disclaimer:
The content provided in this strategy is for informational and educational purposes only. It is not intended as financial, investment, or trading advice. Trading in cryptocurrency, stocks, or any financial markets involves significant risk, and you may lose more than your initial investment. Past performance is not indicative of future results, and no guarantee of profit can be made. You should consult with a professional financial advisor before making any investment decisions. The creator of this strategy is not responsible for any financial losses or damages incurred as a result of following this strategy. All trades are executed at your own risk.

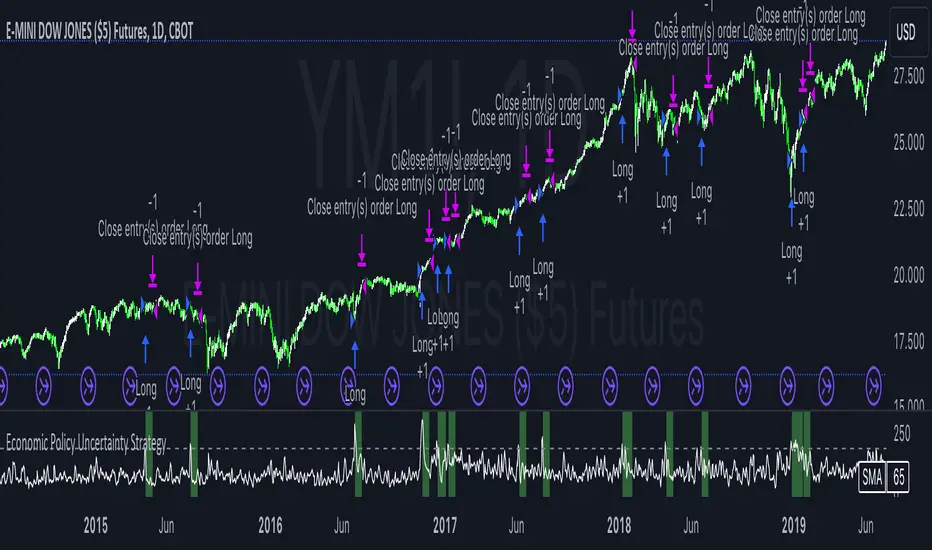
Economic Policy Uncertainty StrategyThis Pine Script strategy is designed to make trading decisions based on the Economic Policy Uncertainty Index for the United States (USEPUINDXD) using a Simple Moving Average (SMA) and a dynamic threshold. The strategy identifies opportunities by entering long positions when the SMA of the Economic Policy Uncertainty Index crosses above a user-defined threshold. An exit is triggered after a set number of bars have passed since the trade was opened. Additionally, the background is highlighted in green when a position is open to visually indicate active trades.
This strategy is intended to be used in portfolio management and trading systems where economic policy uncertainty plays a critical role in decision-making. The index provides insight into macroeconomic conditions, which can affect asset prices and investment returns.
The Economic Policy Uncertainty (EPU) Index is a significant metric used to gauge uncertainty related to economic policies in the United States. This index reflects the frequency of newspaper articles discussing economic uncertainty, government policies, and their potential impact on the economy. It has become a popular indicator for both academics and practitioners to analyze the effects of policy uncertainty on various economic and financial outcomes.
Importance of the EPU Index for Portfolio Decisions:
Economic Policy Uncertainty and Investment Decisions:
Research by Baker, Bloom, and Davis (2016) introduced the Economic Policy Uncertainty Index and explored how increased uncertainty leads to delays in investment and hiring decisions. Their study shows that heightened uncertainty, as captured by the EPU index, is associated with a contraction in economic activity and lower stock market returns. Investors tend to shift their portfolios towards safer assets during periods of high policy uncertainty .
Impact on Asset Prices:
Gulen and Ion (2016) demonstrated that policy uncertainty adversely affects corporate investment, leading to lower stock market returns. The study emphasized that firms reduce investment during periods of high policy uncertainty, which can significantly impact the pricing of risky assets. Consequently, portfolio managers need to account for policy uncertainty when making asset allocation decisions .
Global Implications:
Policy uncertainty is not only a domestic issue. Brogaard and Detzel (2015) found that U.S. economic policy uncertainty has significant spillover effects on global financial markets, affecting equity returns, bond yields, and foreign exchange rates. This suggests that global investors should incorporate U.S. policy uncertainty into their risk management strategies .
These studies underscore the importance of the Economic Policy Uncertainty Index as a tool for understanding macroeconomic risks and making informed portfolio management decisions. Strategies that incorporate the EPU index, such as the one described above, can help investors navigate periods of uncertainty by adjusting their exposure to different asset classes based on economic conditions.
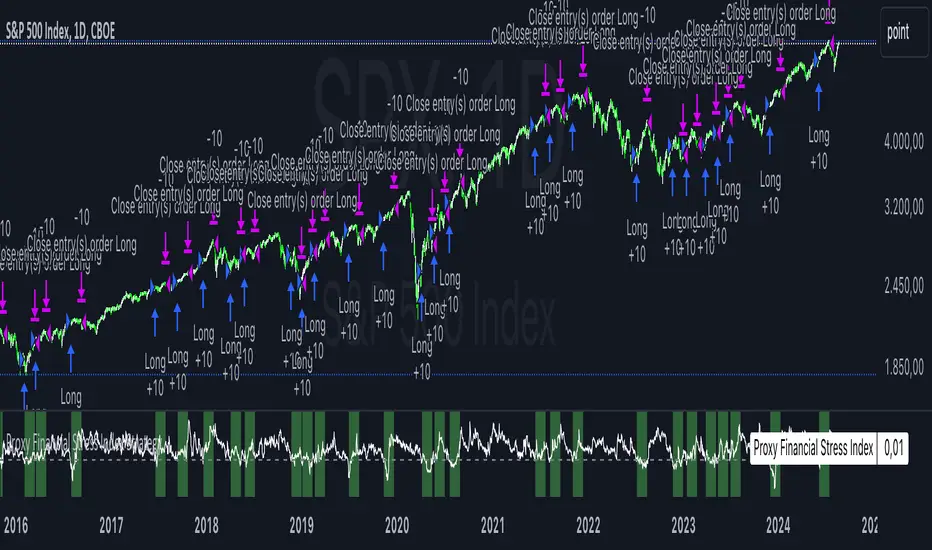
Proxy Financial Stress Index StrategyThis strategy is based on a Proxy Financial Stress Index constructed using several key financial indicators. The strategy goes long when the financial stress index crosses below a user-defined threshold, signaling a potential reduction in market stress. Once a position is opened, it is held for a predetermined number of bars (periods), after which it is automatically closed.
The financial stress index is composed of several normalized indicators, each representing different market aspects:
VIX - Market volatility.
US 10-Year Treasury Yield - Bond market.
Dollar Index (DXY) - Currency market.
S&P 500 Index - Stock market.
EUR/USD - Currency exchange rate.
High-Yield Corporate Bond ETF (HYG) - Corporate bond market.
Each component is normalized using a Z-score (based on the user-defined moving average and standard deviation lengths) and weighted according to user inputs. The aggregated index reflects overall market stress.
The strategy enters a long position when the stress index crosses below a specified threshold from above, indicating reduced financial stress. The position is held for a defined holding period before being closed automatically.
Scientific References:
The concept of a financial stress index is derived from research that combines multiple financial variables to measure systemic risks in the financial markets. Key research includes:
The Financial Stress Index developed by various Federal Reserve banks, including the Cleveland Financial Stress Index (CFSI)
Bank of America Merrill Lynch Option Volatility Estimate (MOVE) Index as a measure of interest rate volatility, which correlates with financial stress
These indices are widely used in economic research to gauge financial instability and help in policy decisions. They track real-time fluctuations in various markets and are often used to anticipate economic downturns or periods of high financial risk.
[INVX] Post-Earnings Announcement DriftWhat does this strategy do?
This Pine Script strategy implements the Post-earnings announcement drift (PEAD) strategy, which is a financial market anomaly where a stock's price tends to drift in the direction of the firm's earnings surprise for an extended period of time.
Ref: en.wikipedia.org
An earnings announcement is an official public statement of a company's profitability for a specific time period, typically a quarter or a year. It includes various financial metrics but the most watched figure is the Earnings Per Share (EPS). Analysts estimate the EPS before the announcement, and the actual EPS is compared to this estimate to determine if there was an earnings surprise.
An earnings surprise occurs when the actual EPS is significantly different from the analysts' estimates. A positive earnings surprise indicates that the actual EPS is higher than the estimate, while a negative earnings surprise suggests the EPS is lower than anticipated.
The script takes the following inputs
" Holding periods (bar) " : This input defines the number of periods (or bars) the script will hold a position after the earnings announcement.
" Surprise threshold (%) ": This input sets the minimum percentage for an earnings surprise, which triggers the strategy to enter either a long or short position. In essence, it represents the minimum deviation between the estimated and actual Earnings Per Share (EPS) that will trigger a trade. A higher threshold may lead to fewer, potentially more significant trades, while a lower threshold might result in more frequent, possibly less impactful trades. This parameter allows you to adjust the sensitivity of the strategy to earnings surprises.
Positive earnings surprise
After the earnings announcement, the script compares the actual EPS with the estimated EPS to identify an earnings surprise. If there is a positive earnings surprise, the script will enter a long position. A long position is a bullish strategy where the investor expects the stock price to rise.
Negative earnings surprise
On the other hand, if there is a negative earnings surprise, the script will enter a short position. A short position is a bearish strategy where the investor expects the stock price to fall.
In both scenarios, the position (either long or short) is held for the number of periods specified in the "Holding periods (bar)" input. This strategy is based on the assumption that the stock price will continue to drift in the direction of the earnings surprise for the specified holding period.
Disclaimer: The script provided herein is for educational purposes only. It should not be considered as investment advice or a recommendation of any particular security, strategy or investment product. Past performance is not indicative of future results.
The results of the Pine Script backtesting are hypothetical and should not be considered as a true reflection of the results that might be achieved in a live trading environment. The backtest results are based on historical data and may not take into account certain factors such as actual transaction costs, taxes, or changes in market conditions.
Investors should consult with their financial advisor before making any investment decisions. All investments involve risk, including the potential loss of all invested capital.

Intelle_city - World Cycle - Ath & Atl - Logarithmic - Strategy.Overview
Indicators: Strategy !
INTELLECT_city - World Cycle - ATH & ATL - Timeframe 1D and 1W - Logarithmic - Strategy - The Pi Cycle Top and Bottom Oscillator is an adaptation of the original Pi Cycle Top chart. It compares the 111-Day Moving Average circle and the 2 * 350-Day Moving Average circle of Bitcoin’s Price. These two moving averages were selected as 350 / 111 = 3.153; An approximation of the important mathematical number Pi.
When the 111-Day Moving Average circle reaches the 2 * 350-Day Moving Average circle, it indicates that the market is becoming overheated. That is because the mid time frame momentum reference of the 111-Day Moving Average has caught up with the long timeframe momentum reference of the 2 * 350-Day Moving Average.
Historically this has occurred within 3 days of the very top of each market cycle.
When the 111 Day Moving Average circle falls back beneath the 2 * 350 Day Moving Average circle, it indicates that the market momentum of that cycle is significantly cooling down. The oscillator drops down into the lower green band shown where the 111 Day Moving Average is moving at a 75% discount relative to the 2 * 350 Day Moving Average.
Historically, this has highlighted broad areas of bear market lows.
IMPORTANT: You need to set a LOGARITHMIC graph. (The function is located at the bottom right of the screen)
IMPORTANT: The INTELLECT_city indicator is made for a buy-sell strategy; there is also a signal indicator from INTELLECT_city
IMPORTANT: The Chart shows all cycles, both buying and selling.
IMPORTANT: Suitable timeframes are 1 daily (recommended) and 1 weekly
-----------------------------
Описание на русском:
-----------------------------
Обзор индикатора
INTELLECT_city - World Cycle - ATH & ATL - Timeframe 1D and 1W - Logarithmic - Strategy - Логарифмический - Сигнал - Осциллятор вершины и основания цикла Пи представляет собой адаптацию оригинального графика вершины цикла Пи. Он сравнивает круг 111-дневной скользящей средней и круг 2 * 350-дневной скользящей средней цены Биткойна. Эти две скользящие средние были выбраны как 350/111 = 3,153; Приближение важного математического числа Пи.
Когда круг 111-дневной скользящей средней достигает круга 2 * 350-дневной скользящей средней, это указывает на то, что рынок перегревается. Это происходит потому, что опорный моментум среднего временного интервала 111-дневной скользящей средней догнал опорный момент импульса длинного таймфрейма 2 * 350-дневной скользящей средней.
Исторически это происходило в течение трех дней после вершины каждого рыночного цикла.
Когда круг 111-дневной скользящей средней опускается ниже круга 2 * 350-дневной скользящей средней, это указывает на то, что рыночный импульс этого цикла значительно снижается. Осциллятор опускается в нижнюю зеленую полосу, показанную там, где 111-дневная скользящая средняя движется со скидкой 75% относительно 2 * 350-дневной скользящей средней.
Исторически это высветило широкие области минимумов медвежьего рынка.
ВАЖНО: Выставлять нужно ЛОГАРИФМИЧЕСКИЙ график. (Находиться функция с правой нижней части экрана)
ВАЖНО: Индикатор INTELLECT_city сделан для стратегии покупок продаж, есть также и сигнальный от INTELLECT_сity
ВАЖНО: На Графике видны все циклы, как на покупку так и на продажу.
ВАЖНО: Подходящие таймфреймы 1 дневной (рекомендовано) и 1 недельный
-----------------------------
Beschreibung - Deutsch
-----------------------------
Indikatorübersicht
INTELLECT_city – Weltzyklus – ATH & ATL – Zeitrahmen 1T und 1W – Logarithmisch – Strategy – Der Pi-Zyklus-Top- und Bottom-Oszillator ist eine Anpassung des ursprünglichen Pi-Zyklus-Top-Diagramms. Er vergleicht den 111-Tage-Gleitenden-Durchschnittskreis und den 2 * 350-Tage-Gleitenden-Durchschnittskreis des Bitcoin-Preises. Diese beiden gleitenden Durchschnitte wurden als 350 / 111 = 3,153 ausgewählt; eine Annäherung an die wichtige mathematische Zahl Pi.
Wenn der 111-Tage-Gleitenden-Durchschnittskreis den 2 * 350-Tage-Gleitenden-Durchschnittskreis erreicht, deutet dies darauf hin, dass der Markt überhitzt. Das liegt daran, dass der Momentum-Referenzwert des 111-Tage-Gleitenden-Durchschnitts im mittleren Zeitrahmen den Momentum-Referenzwert des 2 * 350-Tage-Gleitenden-Durchschnitts im langen Zeitrahmen eingeholt hat.
Historisch gesehen geschah dies innerhalb von 3 Tagen nach dem Höhepunkt jedes Marktzyklus.
Wenn der Kreis des 111-Tage-Durchschnitts wieder unter den Kreis des 2 x 350-Tage-Durchschnitts fällt, deutet dies darauf hin, dass die Marktdynamik dieses Zyklus deutlich nachlässt. Der Oszillator fällt in das untere grüne Band, in dem der 111-Tage-Durchschnitt mit einem Abschlag von 75 % gegenüber dem 2 x 350-Tage-Durchschnitt verläuft.
Historisch hat dies breite Bereiche mit Tiefstständen in der Baisse hervorgehoben.
WICHTIG: Sie müssen ein logarithmisches Diagramm festlegen. (Die Funktion befindet sich unten rechts auf dem Bildschirm)
WICHTIG: Der INTELLECT_city-Indikator ist für eine Kauf-Verkaufs-Strategie konzipiert; es gibt auch einen Signalindikator von INTELLECT_city
WICHTIG: Das Diagramm zeigt alle Zyklen, sowohl Kauf- als auch Verkaufszyklen.
WICHTIG: Geeignete Zeitrahmen sind 1 täglich (empfohlen) und 1 wöchentlich

TASC 2024.06 REIT ETF Trading System█ OVERVIEW
This strategy script demonstrates the application of the Real Estate Investment Trust (REIT) ETF trading system presented in the article by Markos Katsanos titled "Is The Price REIT?" from TASC's June 2024 edition of Traders' Tips .
█ CONCEPTS
REIT stocks and ETFs offer a simplified, diversified approach to real estate investment. They exhibit sensitivity to interest rates, often moving inversely to interest rate and treasury yield changes. Markos Katsanos explores this relationship and the correlation of prices with the broader market to develop a trading strategy for REIT ETFs.
The script employs Bollinger Bands and Donchian channel indicators to identify oversold conditions and trends in REIT ETFs. It incorporates the 10-year treasury yield index (TNX) as a proxy for interest rates and the S&P 500 ETF (SPY) as a benchmark for the overall market. The system filters trade entries based on their behavior and correlation with the REIT ETF price.
█ CALCULATIONS
The strategy initiates long entries (buy signals) under two conditions:
1. Oversold condition
The weekly ETF low price dips below the 15-week Bollinger Band bottom, the closing price is above the value by at least 0.2 * ATR ( Average True Range ), and the price exceeds the week's median.
Either of the following:
– The TNX index is down over 15% from its 25-week high, and its correlation with the ETF price is less than 0.3.
– The yield is below 2%.
2. Uptrend
The weekly ETF price crosses above the previous week's 30-week Donchian channel high.
The SPY ETF is above its 20-week moving average.
Either of the following:
– Over ten weeks have passed since the TNX index was at its 30-week high.
– The correlation between the TNX value and the ETF price exceeds 0.3.
– The yield is below 2%.
The strategy also includes three exit (sell) rules:
1. Trailing (Chandelier) stop
The weekly close drops below the highest close over the last five weeks by over 1.5 * ATR.
The TNX value rises over the latest 25 weeks, with a yield exceeding 4%, or its value surges over 15% above the 25-week low.
2. Stop-loss
The ETF's price declines by at least 8% of the previous week's close and falls below the 30-week moving average.
The SPY price is down by at least 8%, or its correlation with the ETF's price is negative.
3. Overbought condition
The ETF's value rises above the 100-week low by over 50%.
The ETF's price falls over 1.5 * ATR below the 3-week high.
The ETF's 10-week Stochastic indicator exceeds 90 within the last three weeks.
█ DISCLAIMER
This strategy script educates users on the system outlined by the TASC article. However, note that its default properties might not fully represent real-world trading conditions for an individual. By default, it uses 10% of equity as the order size and a slippage amount of 5 ticks. Traders should adjust these settings and the commission amount when using this script. Additionally, since this strategy utilizes compound conditions on weekly data to trigger orders, it will generate significantly fewer trades than other, higher-frequency strategies.

Crypto MVRV ZScore - Strategy [PresentTrading]█ Introduction and How it is Different
The "Crypto Valuation Extremes: MVRV ZScore - Strategy " represents a cutting-edge approach to cryptocurrency trading, leveraging the Market Value to Realized Value (MVRV) Z-Score. This metric is pivotal for identifying overvalued or undervalued conditions in the crypto market, particularly Bitcoin. It assesses the current market valuation against the realized capitalization, providing insights that are not apparent through conventional analysis.
BTCUSD 6h Long/Short Performance
Local
█ Strategy, How It Works: Detailed Explanation
The strategy leverages the Market Value to Realized Value (MVRV) Z-Score, specifically designed for cryptocurrencies, with a focus on Bitcoin. This metric is crucial for determining whether Bitcoin is currently undervalued or overvalued compared to its historical 'realized' price. Below is an in-depth explanation of the strategy's components and calculations.
🔶Conceptual Foundation
- Market Capitalization (MC): This represents the total dollar market value of Bitcoin's circulating supply. It is calculated as the current price of Bitcoin multiplied by the number of coins in circulation.
- Realized Capitalization (RC): Unlike MC, which values all coins at the current market price, RC is computed by valuing each coin at the price it was last moved or traded. Essentially, it is a summation of the value of all bitcoins, priced at the time they were last transacted.
- MVRV Ratio: This ratio is derived by dividing the Market Capitalization by the Realized Capitalization (The ratio of MC to RC (MVRV Ratio = MC / RC)). A ratio greater than 1 indicates that the current price is higher than the average price at which all bitcoins were purchased, suggesting potential overvaluation. Conversely, a ratio below 1 suggests undervaluation.
🔶 MVRV Z-Score Calculation
The Z-Score is a statistical measure that indicates the number of standard deviations an element is from the mean. For this strategy, the MVRV Z-Score is calculated as follows:
MVRV Z-Score = (MC - RC) / Standard Deviation of (MC - RC)
This formula quantifies Bitcoin's deviation from its 'normal' valuation range, offering insights into market sentiment and potential price reversals.
🔶 Spread Z-Score for Trading Signals
The strategy refines this approach by calculating a 'spread Z-Score', which adjusts the MVRV Z-Score over a specific period (default: 252 days). This is done to smooth out short-term market volatility and focus on longer-term valuation trends. The spread Z-Score is calculated as follows:
Spread Z-Score = (Market Z-Score - MVVR Ratio - SMA of Spread) / Standard Deviation of Spread
Where:
- SMA of Spread is the simple moving average of the spread over the specified period.
- Spread refers to the difference between the Market Z-Score and the MVRV Ratio.
🔶 Trading Signals
- Long Entry Condition: A long (buy) signal is generated when the spread Z-Score crosses above the long entry threshold, indicating that Bitcoin is potentially undervalued.
- Short Entry Condition: A short (sell) signal is triggered when the spread Z-Score falls below the short entry threshold, suggesting overvaluation.
These conditions are based on the premise that extreme deviations from the mean (as indicated by the Z-Score) are likely to revert to the mean over time, presenting opportunities for strategic entry and exit points.
█ Practical Application
Traders use these signals to make informed decisions about opening or closing positions in the Bitcoin market. By quantifying market valuation extremes, the strategy aims to capitalize on the cyclical nature of price movements, identifying high-probability entry and exit points based on historical valuation norms.
█ Trade Direction
A unique feature of this strategy is its configurable trade direction. Users can specify their preference for engaging in long positions, short positions, or both. This flexibility allows traders to tailor the strategy according to their risk tolerance, market outlook, or trading style, making it adaptable to various market conditions and trader objectives.
█ Usage
To implement this strategy, traders should first adjust the input parameters to align with their trading preferences and risk management practices. These parameters include the trade direction, Z-Score calculation period, and the thresholds for long and short entries. Once configured, the strategy automatically generates trading signals based on the calculated spread Z-Score, providing clear indications for potential entry and exit points.
It is advisable for traders to backtest the strategy under different market conditions to validate its effectiveness and adjust the settings as necessary. Continuous monitoring and adjustment are crucial, as market dynamics evolve over time.
█ Default Settings
- Trade Direction: Both (Allows for both long and short positions)
- Z-Score Calculation Period: 252 days (Approximately one trading year, capturing a comprehensive market cycle)
- Long Entry Threshold: 0.382 (Indicative of moderate undervaluation)
- Short Entry Threshold: -0.382 (Signifies moderate overvaluation)
These default settings are designed to balance sensitivity to market valuation extremes with a pragmatic approach to trade execution. They aim to filter out noise and focus on significant market movements, providing a solid foundation for both new and experienced traders looking to exploit the unique insights offered by the MVRV Z-Score in the cryptocurrency market.

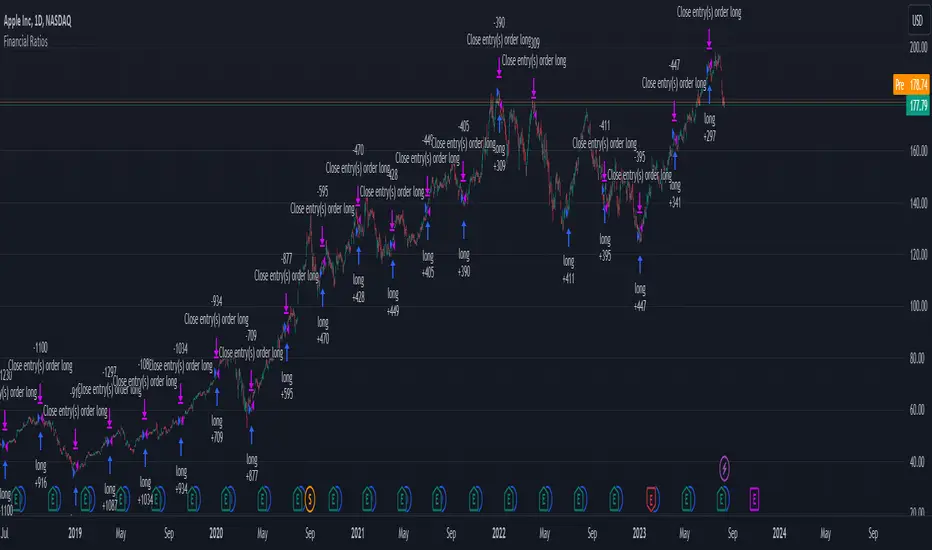
Financial Ratios Fundamental StrategyWhat are financial ratios?
Financial ratios are basic calculations using quantitative data from a company’s financial statements. They are used to get insights and important information on the company’s performance, profitability, and financial health.
Common financial ratios come from a company’s balance sheet, income statement, and cash flow statement.
Businesses use financial ratios to determine liquidity, debt concentration, growth, profitability, and market value.
The common financial ratios every business should track are
1) liquidity ratios
2) leverage ratios
3)efficiency ratio
4) profitability ratios
5) market value ratios.
Initially I had a big list of 20 different ratios for testing, but in the end I decided to stick for the strategy with these ones :
Current ratio: Current Assets / Current Liabilities
The current ratio measures how a business’s current assets, such as cash, cash equivalents, accounts receivable, and inventories, are used to settle current liabilities such as accounts payable.
Interest coverage ratio: EBIT / Interest expenses
Companies generally pay interest on corporate debt. The interest coverage ratio shows if a company’s revenue after operating expenses can cover interest liabilities.
Payables turnover ratio: Cost of Goods sold (or net credit purchases) / Average Accounts Payable
The payables turnover ratio calculates how quickly a business pays its suppliers and creditors.
Gross margin: Gross profit / Net sales
The gross margin ratio measures how much profit a business makes after the cost of goods and services compared to net sales.
With this data, I have created the long and long exit strategy:
For long, if any of the 4 listed ratios,such as current ratio or interest coverage ratio or payable turn ratio or gross margin ratio is ascending after a quarter, its a potential long entry.
For example in january the gross margin ratio is at 10% and in april is at 15%, this is an increase from a quarter to another, so it will get a long entry trigger.
The same could happen if any of the 4 listed ratios follow the ascending condition since they are all treated equally as important
For exit, if any of the 4 listed ratios are descending after a quarter, such as current ratio or interest coverage ratio or payable turn ratio or gross margin ratio is descending after a quarter, its a potential long exit.
For example in april we entered a long trade, and in july data from gross margin comes as 12% .
In this case it fell down from 15% to 12%, triggering an exit for our trade.
However there is a special case with this strategy, in order to make it more re active and make use of the compound effect:
So lets say on july 1 when the data came in, the gross margin data came descending (indicating an exit for the long trade), however at the same the interest coverage ratio came as positive, or any of the other 3 left ratios left . In that case the next day after the trade closed, it will enter a new long position and wait again until a new quarter data for the financial is being published.
Regarding the guidelines of tradingview, they recommend to have more than 100 trades.
With this type of strategy, using Daily timeframe and data from financials coming each quarter(4 times a year), we only have the financial data available since 2016, so that makes 28 quarters of data, making a maximum potential of 28 trades.
This can however be "bypassed" to check the integrity of the strategy and its edge, by taking for example multiple stocks and test them in a row, for example, appl, msft, goog, brk and so on, and you can see the correlation between them all.
At the same time I have to say that this strategy is more as an educational one since it miss a risk management and other additional filters to make it more adapted for real live trading, and instead serves as a guiding tool for those that want to make use of fundamentals in their trades
If you have any questions, please let me know !
Range BreakerStrategy Description: Range Breaker
The Range Breaker strategy is a breakout trading strategy that aims to capture profits when the price of a financial instrument moves out of a defined range. The strategy identifies swing highs and swing lows over a specified lookback period and enters long or short positions when the price breaks above the swing high or below the swing low, respectively. It also employs stop targets based on a percentage to manage risk and protect profits.
Beginner's Guide:
Understand the concepts:
a. Swing High: A swing high is a local peak in price where the price is higher than the surrounding prices.
b. Swing Low: A swing low is a local trough in price where the price is lower than the surrounding prices.
c. Lookback Period: The number of bars or periods the strategy analyzes to determine swing highs and swing lows.
d. Stop Target: A predetermined price level at which the strategy will exit the position to manage risk and protect profits.
Configure the strategy:
a. Set the initial capital, order size, commission, and pyramiding as needed for your specific trading account.
b. Choose the desired lookback period to identify the swing highs and lows.
c. Set the stop target multiplier and stop target percentage as desired to manage risk and protect profits.
Backtest the strategy:
a. Set the backtest start date to analyze the strategy's historical performance.
b. Observe the backtesting results to evaluate the strategy's effectiveness and adjust the parameters if necessary.
Implement the strategy:
a. Apply the strategy to your preferred financial instrument on the TradingView platform.
b. Monitor the strategy's performance and adjust the parameters as needed to optimize its effectiveness.
Risk management:
a. Always use a stop target to protect your trading capital and manage risk.
b. Don't risk more than a small percentage of your trading capital on a single trade.
c. Be prepared to adjust the strategy or stop trading it if the market conditions change significantly.
Adjusting the Lookback Period and Timeframes for Optimal Strategy Performance
The Range Breaker strategy uses a lookback period to identify swing highs and lows, which serve as the basis for determining entry and exit points for long and short positions. By adjusting the lookback period and analyzing different timeframes, you can potentially find the best strategy configuration for each specific asset.
Adjusting the lookback period:
The lookback period is a critical parameter that affects the sensitivity of the strategy to price movements. A shorter lookback period will make the strategy more sensitive to smaller price fluctuations, resulting in more frequent trading signals. On the other hand, a longer lookback period will make the strategy less sensitive, generating fewer signals but potentially capturing larger price movements.
To optimize the lookback period for a specific asset, you can test different lookback values and compare their performance in terms of risk-adjusted returns, win rate, and other relevant metrics. Keep in mind that using an overly short lookback period may lead to overtrading and increased transaction costs, while an overly long lookback period may cause the strategy to miss profitable trading opportunities.
Analyzing different timeframes:
Timeframes refer to the duration of each bar or candlestick on the chart. Shorter timeframes (e.g., 5-minute, 15-minute, or 30-minute) focus on intraday price movements, while longer timeframes (e.g., daily, weekly, or monthly) capture longer-term trends. The choice of timeframe affects the number of trading signals generated by the strategy and the length of time each position is held.
To find the best strategy for each asset, you can test the Range Breaker strategy on different timeframes and analyze its performance. Keep in mind that shorter timeframes may require more active monitoring and management due to the increased frequency of trading signals. Longer timeframes, on the other hand, may require more patience as positions are held for extended periods.
Finding the best strategy for each asset:
Every asset has unique price characteristics that may affect the performance of a trading strategy. To find the best strategy for each asset, you should:
a. Test various lookback periods and timeframes, observing the strategy's performance in terms of profitability, risk-adjusted returns, and win rate.
b. Consider the asset's historical price behavior, such as its volatility, liquidity, and trend-following or mean-reverting tendencies.
c. Evaluate the strategy's performance during different market conditions, such as bullish, bearish, or sideways markets, to ensure its robustness.
d. Keep in mind that each asset may require a unique set of strategy parameters for optimal performance, and there may be no one-size-fits-all solution.
By experimenting with different lookback periods and timeframes, you can fine-tune the Range Breaker strategy for each specific asset, potentially improving its overall performance and adaptability to changing market conditions. Always practice proper risk management and be prepared to make adjustments as needed.
Remember that trading strategies carry inherent risk, and past performance is not indicative of future results. Always practice proper risk management and consider your own risk tolerance before trading with real money.

MVRV Z Score and MVRV Free Float Z-ScoreIMPORTANT: This script needs as much historic data as possible. Please run it on INDEX:BTCUSD , BNC:BLX or another chart of sufficient length.
MVRV
The MVRV (Market Value to Realised Value Ratio) simply divides bitcoins market cap by bitcoins realized market cap. This was previously impossible on Tradingview but has now been made possible thanks to Coinmetrics providing us with the realized market cap data.
In the free float version, the free float market cap is used instead of the regular market cap.
Z-Score
The MVRV Z-score divides the difference between Market cap and realized market cap by the historic standard deviation of the market cap.
Historically, this has been insanely accurate at detecting bitcoin tops and bottoms:
A Z-Score above 7 means bitcoin is vastly overpriced and at a local top.
A Z-Score below 0.1 means bitcoin is underpriced and at a local bottom.
In the free float version, the free float market cap is used instead of the regular market cap.
The Z-Score, also known as the standard score is hugely popular in a wide range of mathematical and statistical fields and is usually used to measure the number of standard deviations by which the value of a raw score is above or below the mean value of what is being observed or measured.
Credits
MVRV Z Score initially created by aweandwonder
MVRV initially created by Murad Mahmudov and David Puell

Big Whale Purchases and SalesBig Whale Purchases and Sales - plots big whale transactions on your chart!
People that hold more than 1% of a crypto currencies circulating supply are considered whales and have a huge influence on price, not just because they can move the market with their huge transactions, but also because other traders often track their wallets and follow their example. Taking a look at whale holdings, one can see why whale worship is so common in crypto: While Bitcoin has a relatively low whale concentration, many of the Top 100 Cryptocurrencies have whales control 60% or more of their circulating supply.
Integrating IntoTheBlock data, this script plots the transactions of these whales and, in strategy mode, copy trades them.
Features:
Strategy Mode: Switches the script between an indicator and a strategy.
Standard Deviations: The number of Standard Deviations that a transaction needs to surpass to be considered worth plotting. Setting this to 0 will show all whale transactions, higher settings will only show the biggest transactions.
Blockchain: The Chain on which Whale activity is tracked.
