SWING IDEA - RATNAMANI MET AND TUBRatnamani Metals & Tubes, a leading manufacturer of stainless steel and carbon steel welded pipes and tubes, is showing a potential swing trade setup with several bullish technical signals.
Reasons are listed below :
3800 Zone Break Out : The 3800 level has acted as a strong resistance zone. The
Next report date
≈
August 6
Report period
Q1 2025
EPS estimate
20.70 INR
Revenue estimate
12.80 B INR
77.05 INR
5.44 B INR
51.86 B INR
20.98 M
About RATNAMANI MET & TUB LTD.
Sector
Industry
CEO
Manoj Prakash Sanghvi
Website
Headquarters
Ahmedabad
Founded
1983
ISIN
INE703B01027
FIGI
BBG000CYKK77
Ratnamani Metals & Tubes Ltd. is a holding company, which engages in the manufacturing of tube and tube fittings of basic iron and steel. It operates through the following segments: Steel Tubes and Pipes, Bearing Rings, and Pipe Spools and Auxiliary Support Systems. The company was founded by Prakash Mishrimal Sanghvi and Jayantilal Mistrimal Sanghvi on September 15, 1983 and is headquartered in Ahmedabad, India.
8.5%
9.6%
10.7%
11.8%
12.9%
Q4 '23
Q1 '24
Q2 '24
Q3 '24
Q4 '24
0.00
5.00 B
10.00 B
15.00 B
20.00 B
Revenue
Net income
Net margin %
Revenue
COGS
Gross profit
Op expenses
Op income
Non-Op income/ expenses
Taxes & Other
Net income
0.00
5.00 B
10.00 B
15.00 B
20.00 B
Revenue
COGS
Gross profit
Expenses & adjustments
Net income
0.00
5.00 B
10.00 B
15.00 B
20.00 B
Q4 '23
Q1 '24
Q2 '24
Q3 '24
Q4 '24
0.00
700.00 M
1.40 B
2.10 B
2.80 B
Debt
Free cash flow
Cash & equivalents
No news here
Looks like there's nothing to report right now

RATNAMANI : Liquidity and Wave Patterns AlignHeadline: Liquidity and Wave Patterns Align – Strategic Buying Opportunity
Technical Analysis:
Structure: The price action has retraced into the deep retracement zone of 113%-127% Fibonacci extension of the last swing. This zone often attracts liquidity and signals potential reversals.
Wav

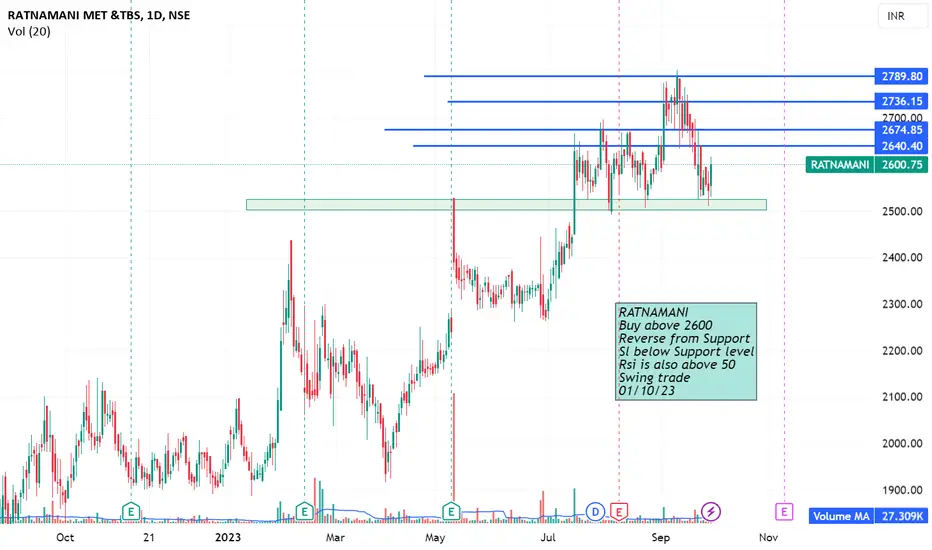
RATNAMANI S/RSupport and Resistance Levels:
Support Levels: These are price points (green line/shade) where a downward trend may be halted due to a concentration of buying interest. Imagine them as a safety net where buyers step in, preventing further decline.
Resistance Levels: Conversely, resistance levels (re


Go long - swing pick- this stock shows signficant delivery percentage value
- possible chances for accumulation
- may perform good in upcoming days
- line marked in chart is the day it showed huge delivery percentage.i consider it as signal candle.i marked its high and low
entry
- go long with 1:1.5 RR
- take entr

Ratnamani can benefit many if it closes above Mother Line.Ratnamani Metals & tubes Ltd. is a company manufacturing pipes and tubes of Mild steel, Stainless steel, Alloy steel as well as Titanium welded tubes. They also provide anti-corrosive coating solutions for pipes in addition to induction bending solutions.
Negative aspect of the company is that Mut


RATNAMANIRATNAMANI - CMP 1996.45
In Scope Details
Breaking Out the Triangle pattern which has three resistance
Risk would be less
Higher time frame it looks too good
Immediate stop would be 1881
Trade at your own risk, if you are benefited out this analysis, plz feed a poor.
Plz share and comment your th

See all ideas
Summarizing what the indicators are suggesting.
Neutral
SellBuy
Strong sellStrong buy
Strong sellSellNeutralBuyStrong buy
Neutral
SellBuy
Strong sellStrong buy
Strong sellSellNeutralBuyStrong buy
Neutral
SellBuy
Strong sellStrong buy
Strong sellSellNeutralBuyStrong buy
An aggregate view of professional's ratings.
Neutral
SellBuy
Strong sellStrong buy
Strong sellSellNeutralBuyStrong buy
Neutral
SellBuy
Strong sellStrong buy
Strong sellSellNeutralBuyStrong buy
Neutral
SellBuy
Strong sellStrong buy
Strong sellSellNeutralBuyStrong buy
Displays a symbol's price movements over previous years to identify recurring trends.
Frequently Asked Questions
The current price of RATNAMANI is 2,882.90 INR — it has decreased by −0.08% in the past 24 hours. Watch RATNAMANI MET & TUB LTD. stock price performance more closely on the chart.
Depending on the exchange, the stock ticker may vary. For instance, on NSE exchange RATNAMANI MET & TUB LTD. stocks are traded under the ticker RATNAMANI.
RATNAMANI stock has risen by 3.84% compared to the previous week, the month change is a 7.37% rise, over the last year RATNAMANI MET & TUB LTD. has showed a −14.52% decrease.
We've gathered analysts' opinions on RATNAMANI MET & TUB LTD. future price: according to them, RATNAMANI price has a max estimate of 3,950.00 INR and a min estimate of 3,354.00 INR. Watch RATNAMANI chart and read a more detailed RATNAMANI MET & TUB LTD. stock forecast: see what analysts think of RATNAMANI MET & TUB LTD. and suggest that you do with its stocks.
RATNAMANI reached its all-time high on Sep 13, 2024 with the price of 3,978.50 INR, and its all-time low was 21.05 INR and was reached on Mar 5, 2009. View more price dynamics on RATNAMANI chart.
See other stocks reaching their highest and lowest prices.
See other stocks reaching their highest and lowest prices.
RATNAMANI stock is 2.08% volatile and has beta coefficient of 0.70. Track RATNAMANI MET & TUB LTD. stock price on the chart and check out the list of the most volatile stocks — is RATNAMANI MET & TUB LTD. there?
Today RATNAMANI MET & TUB LTD. has the market capitalization of 202.90 B, it has increased by 3.71% over the last week.
Yes, you can track RATNAMANI MET & TUB LTD. financials in yearly and quarterly reports right on TradingView.
RATNAMANI MET & TUB LTD. is going to release the next earnings report on Aug 6, 2025. Keep track of upcoming events with our Earnings Calendar.
RATNAMANI earnings for the last quarter are 32.10 INR per share, whereas the estimation was 26.45 INR resulting in a 21.36% surprise. The estimated earnings for the next quarter are 20.70 INR per share. See more details about RATNAMANI MET & TUB LTD. earnings.
RATNAMANI MET & TUB LTD. revenue for the last quarter amounts to 17.15 B INR, despite the estimated figure of 15.96 B INR. In the next quarter, revenue is expected to reach 12.80 B INR.
RATNAMANI net income for the last quarter is 2.07 B INR, while the quarter before that showed 1.31 B INR of net income which accounts for 57.74% change. Track more RATNAMANI MET & TUB LTD. financial stats to get the full picture.
Yes, RATNAMANI dividends are paid annually. The last dividend per share was 14.00 INR. As of today, Dividend Yield (TTM)% is 0.48%. Tracking RATNAMANI MET & TUB LTD. dividends might help you take more informed decisions.
RATNAMANI MET & TUB LTD. dividend yield was 0.54% in 2024, and payout ratio reached 18.12%. The year before the numbers were 0.50% and 15.76% correspondingly. See high-dividend stocks and find more opportunities for your portfolio.
EBITDA measures a company's operating performance, its growth signifies an improvement in the efficiency of a company. RATNAMANI MET & TUB LTD. EBITDA is 8.24 B INR, and current EBITDA margin is 15.88%. See more stats in RATNAMANI MET & TUB LTD. financial statements.
Like other stocks, RATNAMANI shares are traded on stock exchanges, e.g. Nasdaq, Nyse, Euronext, and the easiest way to buy them is through an online stock broker. To do this, you need to open an account and follow a broker's procedures, then start trading. You can trade RATNAMANI MET & TUB LTD. stock right from TradingView charts — choose your broker and connect to your account.
Investing in stocks requires a comprehensive research: you should carefully study all the available data, e.g. company's financials, related news, and its technical analysis. So RATNAMANI MET & TUB LTD. technincal analysis shows the buy rating today, and its 1 week rating is buy. Since market conditions are prone to changes, it's worth looking a bit further into the future — according to the 1 month rating RATNAMANI MET & TUB LTD. stock shows the neutral signal. See more of RATNAMANI MET & TUB LTD. technicals for a more comprehensive analysis.
If you're still not sure, try looking for inspiration in our curated watchlists.
If you're still not sure, try looking for inspiration in our curated watchlists.