BTCUSD (short-term) strong resistance is ahead
The price start to pump and break previous resistance that we mentioned and get Bullish and now targets reached :
 and now strong resistance zone ahead why?
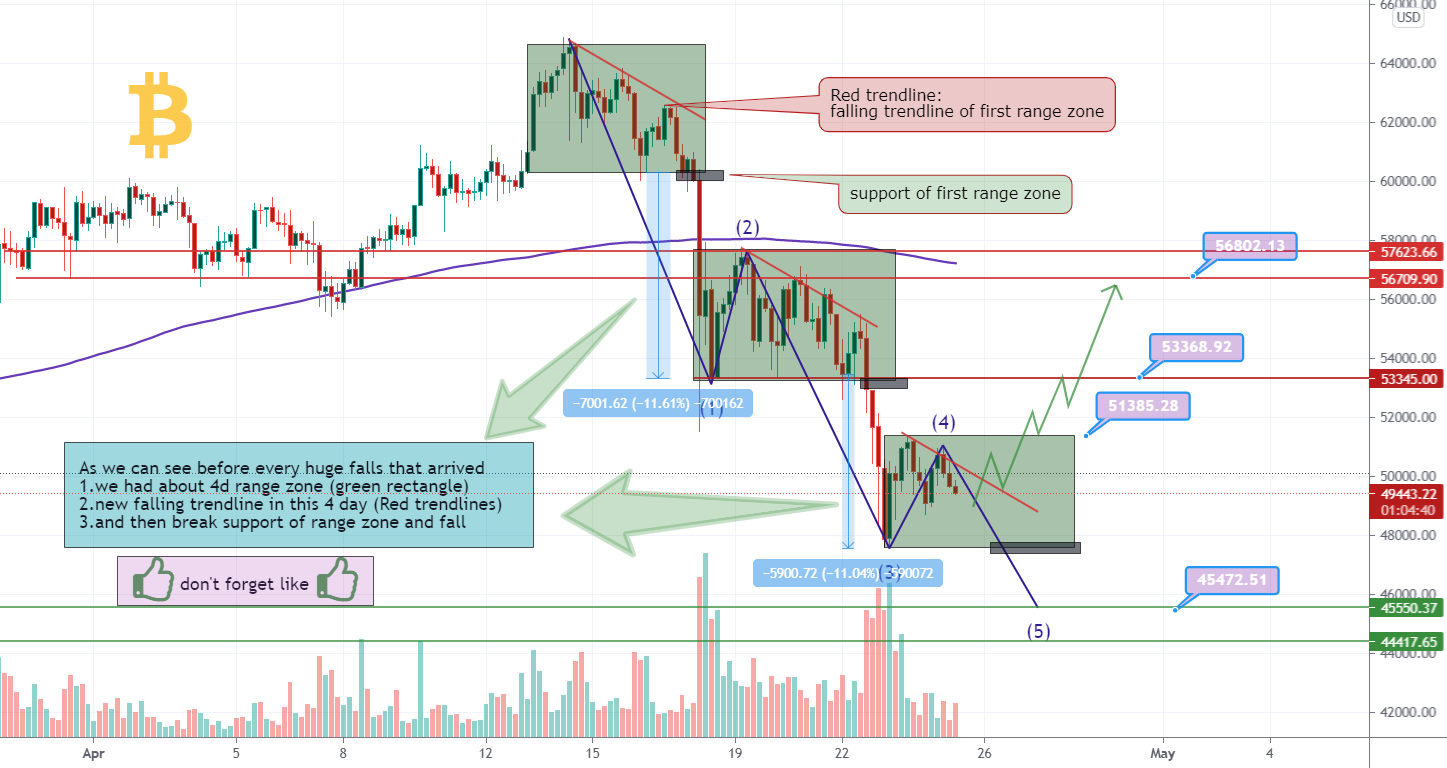
why we are looking for correction near this red rectangle?
the reason perfectly shown on chart above and what is that ?
1.strong trendline that is touching
2.local resistance zone here
<<so black lines on chart above are strong resistance>>
Notice: this analysis is for short-term trader and that's it .
Notice :if and if price get strongly bullish once again and break our resistance zone then we may expect rise like green path after retest
DISCLAIMER:
1.trade carefully and have stop loss for sure
2.Past performance is not indicative of future results.
<<Traders comment below and let me know your opinion about this analysis even simple ((agree)),((not sure))>>
<<press like👍 if you enjoy💚>>
why we are looking for correction near this red rectangle?
1.strong trendline that is touching
2.local resistance zone here
<<so black lines on chart above are strong resistance>>
Notice: this analysis is for short-term trader and that's it .
Notice :if and if price get strongly bullish once again and break our resistance zone then we may expect rise like green path after retest
DISCLAIMER:
1.trade carefully and have stop loss for sure
2.Past performance is not indicative of future results.
<<Traders comment below and let me know your opinion about this analysis even simple ((agree)),((not sure))>>
<<press like👍 if you enjoy💚>>
Handel aktiv:
strong resistance zone touched .
what is next ?
mention in comment
what is next ?
mention in comment
My Free telegram channel:
t.me/mmbtchannel
VIP channels:
Forex:+400 Pips and Crypto +245% monthly PROFIT VIP CHANNELS.
check the pinned message in telegram for more info and plans.
t.me/mmbtchannel
VIP channels:
Forex:+400 Pips and Crypto +245% monthly PROFIT VIP CHANNELS.
check the pinned message in telegram for more info and plans.