OPEN-SOURCE SCRIPT
Options Series - NonOverlay_Technical
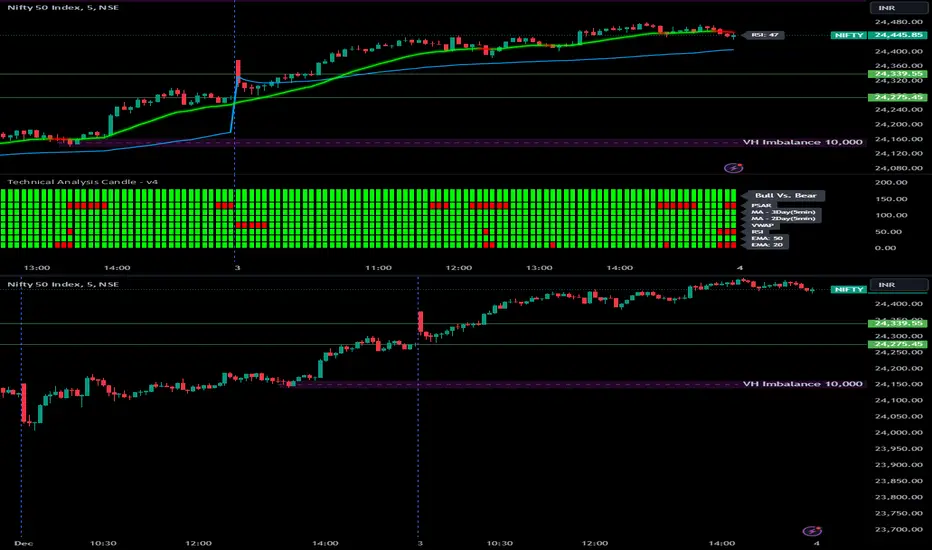
⭐ 1. Purpose:
The script is designed to show technical indicators in a non-overlay form using candlestick representations. It combines multiple popular technical analysis tools to gauge the market's bullish or bearish conditions.
⭐ 2. Indicators:
The script uses several indicators across different timeframes:
- Exponential Moving Averages (EMA) for 5, 20, 50 periods.
- Simple Moving Average (SMA) for 200 periods.
- RSI (Relative Strength Index) for momentum.
- VWAP (Volume Weighted Average Price) for average price evaluation.
- PSAR (Parabolic SAR) for trend direction.
- Daily and multi-day (2-day and 3-day) data for broader market context.
⭐ 3. Candlestick Representation:
The script uses color-coded candlesticks to visually represent various indicators and their bullish/bearish states:
- Green candlesticks for bullish conditions.
- Red candlesticks for bearish conditions.
- Neutral/transparent for non-significant conditions.
⭐ 4. Important Conditions:
It calculates bullish and bearish conditions for each indicator:
- MA20: When the price is above or below the 20-period EMA.
- RSI: When RSI is above or below 50.
- VWAP: When the price is above or below the VWAP.
- PSAR: When the price is above or below the PSAR.
- 2-day and 3-day Moving Averages: Evaluating the broader trend.
⭐ 5. Bullish vs. Bearish Calculation:
The script sums up bullish and bearish signals to determine the overall market condition:
- Current_logical_bull: Counts the number of bullish indicators.
- Current_logical_bear: Counts the number of bearish indicators.
- The script compares these values to conclude whether the market is more bullish or bearish.
⭐ 6. Visual Plotting:
The script uses plotcandle to display the non-overlay signals at different levels for each condition, stacked vertically from MA20 to PSAR. Additionally, a master candle combines all indicators to show an overall market trend.
⭐ 7. Neon Effect on MA20:
It adds a neon-like effect to the MA20 line, making it visually prominent:
- A standard plot line with the base color.
- Two additional neon layers with increasing transparency to enhance the effect.
⭐ 8. Daily Timeframes and Lookahead:
The script fetches daily data using the lookahead feature to get a broader view of the market trend. It tracks the previous day’s and two days' data for comparison.
⭐ 9. Labels and Customization:
The script dynamically adds labels to the chart for the different plotted indicators at the last bar, making it easier to identify which indicator is being represented.
🚀 Conclusion:
The script combines multiple technical indicators, such as EMA, RSI, VWAP, PSAR, and multi-day moving averages, to visually assess bullish and bearish market conditions. It uses color-coded candlesticks to represent each indicator and sums up the signals to determine the overall trend.
Skript med en öppen källkod
In true TradingView spirit, the author of this script has published it open-source, so traders can understand and verify it. Cheers to the author! You may use it for free, but reuse of this code in publication is governed by House rules. Du kan ange den som favorit för att använda den i ett diagram.
Frånsägelse av ansvar
Informationen och publikationerna är inte avsedda att vara, och utgör inte heller finansiella, investerings-, handels- eller andra typer av råd eller rekommendationer som tillhandahålls eller stöds av TradingView. Läs mer i Användarvillkoren.