OPEN-SOURCE SCRIPT
Logarithmic and Linear Fibonacci Levels
Uppdaterad
Introduction
Fibonacci levels are a technical analysis tool used by some traders to identify potential support and resistance levels. The principle for determining these levels is to take the distance between selected reference high and low points (swing high and swing low in general) as 1 unit and mark the ratios derived from the Fibonacci sequence, such as 0.236, 0.382, 0.618, etc., over this 1 unit. In the conventional method of level determination, the 1 unit is divided into equal distances within itself, and Fibonacci levels are determined based on these equal distances. These types of levels are called Linear Levels. A relatively less common method involves dividing the 1 unit into progressively smaller, more accurately described as proportionally equal, distances and determining Fibonacci levels based on these distances. These types are called Logarithmic Levels. The purpose of this indicator is to provide ease of use in determining both Linear and Logarithmic levels.
Where can it be Used?
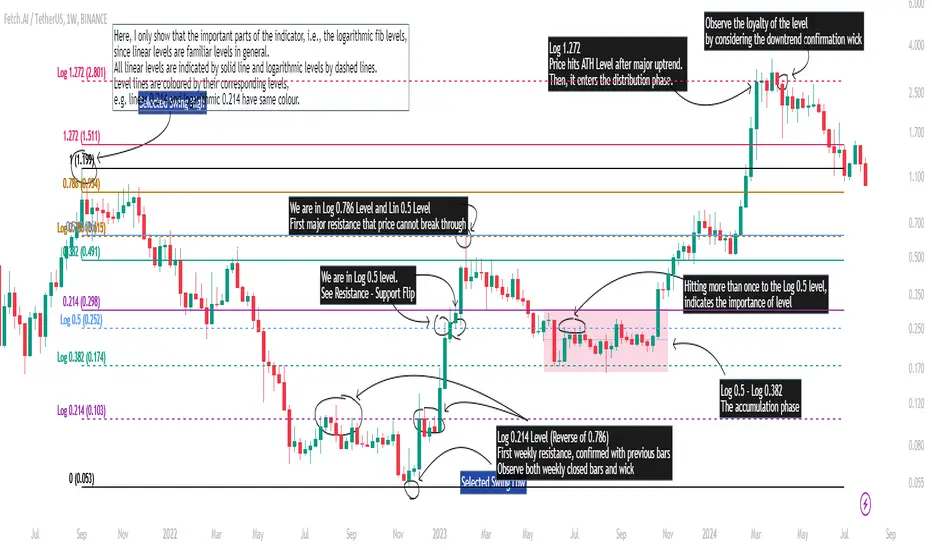
Logarithmic Levels can be used in any instrument where volatility is high for any reason. Specifically in crypto, Logarithmic Levels work very well for
 BTCUSDT (to observe this, please study the wick from January 23, 2024). As another example, Logarithmic Levels can be used to identify potential accumulation and distribution schemes in altcoins with relatively high volume and market capitalization (refer to the chart provided above
  FETUSDT). Additionally, when analyzing traditional markets, Logarithmic Levels can be beneficial for stocks with highly inflated or deflated prices (e.g.,
  TSLA,
TSLA,  NVDA), in stock markets of countries battling high inflation (e.g.,
  XU100), or in currency pairs of countries experiencing a recession (e.g.,
 JPYUSD).
How can it be Used?
It is designed similarly to the Fibonacci Tool provided by Trading View to ensure users feel familiar with it. When you start the indicator, select the reference levels (Level 1 and Level 0), then click on the indicator settings to choose specific levels and customize them according to your preferences.
What Makes it Unique?
Indeed, in the Fibonacci Tool provided by Trading View, we can see both linear and logarithmic levels. However, to view logarithmic levels, it is necessary to switch the relevant instrument's Super Chart to a logarithmic scale. This causes the levels we want to remain 'linear' to also be displayed in their logarithmic form, potentially leading to errors in other indicators we use, incorrect functioning of trend lines drawn in linear scaling, and so on. Additionally, when the Super Chart is scaled logarithmically, it prevents the ability to set alerts for prices and trend lines. This indicator was created to avoid these problems without needing to change the chart's scaling method and to allow the simultaneous viewing of both Linear and Logarithmic levels.
Fibonacci levels are a technical analysis tool used by some traders to identify potential support and resistance levels. The principle for determining these levels is to take the distance between selected reference high and low points (swing high and swing low in general) as 1 unit and mark the ratios derived from the Fibonacci sequence, such as 0.236, 0.382, 0.618, etc., over this 1 unit. In the conventional method of level determination, the 1 unit is divided into equal distances within itself, and Fibonacci levels are determined based on these equal distances. These types of levels are called Linear Levels. A relatively less common method involves dividing the 1 unit into progressively smaller, more accurately described as proportionally equal, distances and determining Fibonacci levels based on these distances. These types are called Logarithmic Levels. The purpose of this indicator is to provide ease of use in determining both Linear and Logarithmic levels.
Where can it be Used?
Logarithmic Levels can be used in any instrument where volatility is high for any reason. Specifically in crypto, Logarithmic Levels work very well for
How can it be Used?
It is designed similarly to the Fibonacci Tool provided by Trading View to ensure users feel familiar with it. When you start the indicator, select the reference levels (Level 1 and Level 0), then click on the indicator settings to choose specific levels and customize them according to your preferences.
What Makes it Unique?
Indeed, in the Fibonacci Tool provided by Trading View, we can see both linear and logarithmic levels. However, to view logarithmic levels, it is necessary to switch the relevant instrument's Super Chart to a logarithmic scale. This causes the levels we want to remain 'linear' to also be displayed in their logarithmic form, potentially leading to errors in other indicators we use, incorrect functioning of trend lines drawn in linear scaling, and so on. Additionally, when the Super Chart is scaled logarithmically, it prevents the ability to set alerts for prices and trend lines. This indicator was created to avoid these problems without needing to change the chart's scaling method and to allow the simultaneous viewing of both Linear and Logarithmic levels.
Versionsinformation
# IntroductionThe Fibonacci Retracement tool is a technical analysis instrument used by traders to identify potential support and resistance levels. The principle behind determining these levels involves measuring the distance between selected reference high and low points (commonly referred to as swing high and swing low) as one unit and marking the ratios derived from the Fibonacci sequence, such as 0.236, 0.382, 0.618, etc., over this unit.
In the conventional method of level determination, the unit is divided into equal segments, and Fibonacci levels are established based on these equal divisions. These levels are referred to as Linear Levels. A relatively less common method involves dividing the unit into proportionally equal distances to determine Fibonacci levels, which are known as Logarithmic Levels.
The purpose of this indicator is to facilitate the determination of both Linear and Logarithmic levels.
# Applications
Logarithmic Levels can be utilized in any market instrument where volatility is high. In the cryptocurrency market, Logarithmic Levels perform particularly well for
Additionally, Logarithmic Levels can be used to identify potential accumulation and distribution patterns in altcoins with relatively high volume and market capitalization (see the chart above
# Usage
The indicator is designed similarly to the Fibonacci Tool provided by Trading View, ensuring familiarity for users. Upon starting the indicator, select the reference levels (Level 1 and Level 0), then access the indicator settings to choose specific levels and customize them according to your preferences.
# Unique Features
In the Fibonacci Tool provided by TradingView, both linear and logarithmic levels are visible. However, viewing logarithmic levels requires switching the relevant instrument's Super Chart to a logarithmic scale. This can lead to errors such that false behaviour in indicators, incorrect functioning of trend lines drawn in linear scaling, disabling the ability to set alerts for prices and trend lines, etc.
This indicator was created to avoid these issues without needing to change the chart's scaling method, and allowing simultaneous viewing of both linear and logarithmic levels.
Skript med en öppen källkod
In true TradingView spirit, the author of this script has published it open-source, so traders can understand and verify it. Cheers to the author! You may use it for free, but reuse of this code in publication is governed by House rules. Du kan ange den som favorit för att använda den i ett diagram.
Frånsägelse av ansvar
Informationen och publikationerna är inte avsedda att vara, och utgör inte heller finansiella, investerings-, handels- eller andra typer av råd eller rekommendationer som tillhandahålls eller stöds av TradingView. Läs mer i Användarvillkoren.