OPEN-SOURCE SCRIPT
Whaley Breadth Thrust Indicator
Uppdaterad
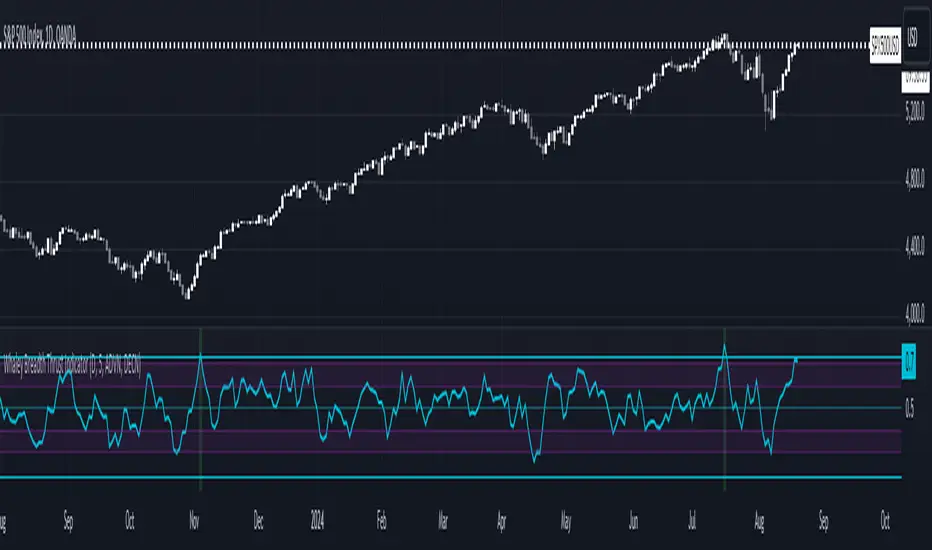
The Whaley Breadth Thrust Indicator (WBT) is a momentum-based technical indicator designed to identify the strength of market trends. It measures the market's breadth by comparing advancing stocks to declining stocks, providing insights into whether a market is in a bullish, neutral, or bearish state. This script calculates the indicator based on the advancing and declining U.S. stocks; however, it can be expanded to other markets as well.
Breadth Thrust Ratio (BTR):
This is calculated as the ratio of advancing stocks to the total number of advancing and declining stocks.
Formula: BTR = Advances / (Advances + Declines + small_offset), where the small offset prevents division errors.
Smoothing:
The BTR is smoothed using a 3-period Exponential Moving Average (EMA) to reduce noise and highlight significant trends.
Thresholds:
0.30: Indicates a strongly bearish market.
0.40: A bearish threshold; crossing below suggests bearish momentum.
0.60: A bullish threshold; crossing above suggests bullish momentum.
0.70: Indicates a strongly bullish market.
Versionsinformation
Changes:- Added several user inputs
- Added additional thresholds
- Modified the calculation method to use SMA and not the EMA to be consistent with Wayne Whaley's paper Planes, Trains and Automobiles
- Added threshold alerts
- Added highlights for statistically significant thresholds
Versionsinformation
Minor code changeSkript med en öppen källkod
In true TradingView spirit, the author of this script has published it open-source, so traders can understand and verify it. Cheers to the author! You may use it for free, but reuse of this code in publication is governed by House rules. Du kan ange den som favorit för att använda den i ett diagram.
Frånsägelse av ansvar
Informationen och publikationerna är inte avsedda att vara, och utgör inte heller finansiella, investerings-, handels- eller andra typer av råd eller rekommendationer som tillhandahålls eller stöds av TradingView. Läs mer i Användarvillkoren.