OPEN-SOURCE SCRIPT
120 GOAT - Simple Moving Average Breakout Indicator
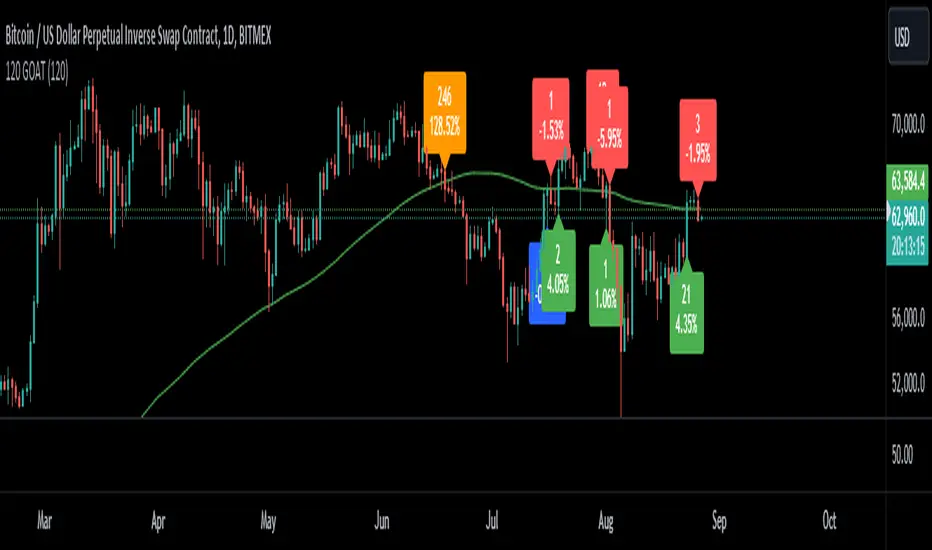
The 120 GOAT indicator is a powerful tool designed to help traders identify key breakout points relative to the 120-day Simple Moving Average (SMA). This indicator tracks when the price crosses above or below the 120-day SMA, marking these transition points on the chart with dynamic labels that indicate the percentage change in price since the last crossover.
With the 120 GOAT indicator, traders can:
Key Features:
How to Use the 120 GOAT Indicator:
Add the Indicator to Your Chart:
Customize the Settings:
Interpret the Signals:
Set Alerts for Key Market Movements:
Monitor the Indicator for Trading Opportunities:
Disclaimer: The 120 GOAT indicator is designed for educational purposes and should not be considered as financial advice. Always conduct your own research and consult with a professional financial advisor before making trading decisions.
With the 120 GOAT indicator, traders can:
- Identify trend reversals when the price crosses the 120-day SMA.
- Monitor price momentum and potential support or resistance levels relative to the 120-day SMA.
- Receive alerts when a breakout occurs above or below the 120-day SMA, ensuring they never miss an important market move.
Key Features:
- 120-day SMA: A customizable 120-day Simple Moving Average that serves as a benchmark for price movements.
- Dynamic Labels: The indicator provides labels showing the number of days since the last crossover and the percentage change in price from the previous crossover.
- Color-coded Breakout Signals: Labels change color based on the nature of the breakout and price movement:
- Above SMA: Green for positive price change, blue for negative.
- Below SMA: Orange for positive price change, red for negative.
- Price Line Tracking: Displays the current price level relative to the SMA.
- Custom Alerts: Set alerts for when the price crosses above or below the 120-day SMA to stay updated on significant market events.
How to Use the 120 GOAT Indicator:
Add the Indicator to Your Chart:
- Open TradingView and go to the chart where you want to use the 120 GOAT indicator.
- Click on the "Indicators" button at the top of the chart.
- Search for "120 GOAT" and select it from the list to apply it to your chart.
Customize the Settings:
- Show 120 MA: Toggle this option on if you want the 120-day SMA to be displayed on your chart.
- MA Color: Choose your preferred color for the 120-day SMA line.
- SMA Length: You can adjust the length of the moving average if you prefer a different period. The default is set to 120 days.
Interpret the Signals:
- When the price crosses above the 120-day SMA, the indicator will display a label below the price bar showing the number of days since the last crossover and the percentage change in price. If the price change is positive, the label is green; if negative, it is blue.
- When the price crosses below the 120-day SMA, a similar label will appear above the price bar. If the price change is positive, the label is orange; if negative, it is red.
Set Alerts for Key Market Movements:
- Go to the Alerts panel and create a new alert.
- Select 120 GOAT as the condition.
- Choose either "Price Crossed Above SMA 120" or "Price Crossed Below SMA 120" as the alert criteria.
- Configure the alert frequency and other settings as needed, then click "Create."
Monitor the Indicator for Trading Opportunities:
- Use the breakout signals and percentage change information to identify potential trading opportunities.
- Combine this indicator with other technical analysis tools to validate trade setups and enhance decision-making.
Disclaimer: The 120 GOAT indicator is designed for educational purposes and should not be considered as financial advice. Always conduct your own research and consult with a professional financial advisor before making trading decisions.
Skript med en öppen källkod
In true TradingView spirit, the author of this script has published it open-source, so traders can understand and verify it. Cheers to the author! You may use it for free, but reuse of this code in publication is governed by House rules. Du kan ange den som favorit för att använda den i ett diagram.
Frånsägelse av ansvar
Informationen och publikationerna är inte avsedda att vara, och utgör inte heller finansiella, investerings-, handels- eller andra typer av råd eller rekommendationer som tillhandahålls eller stöds av TradingView. Läs mer i Användarvillkoren.