PROTECTED SOURCE SCRIPT
ANNAM MACD mixed indicator [PlungerMen]
Uppdaterad
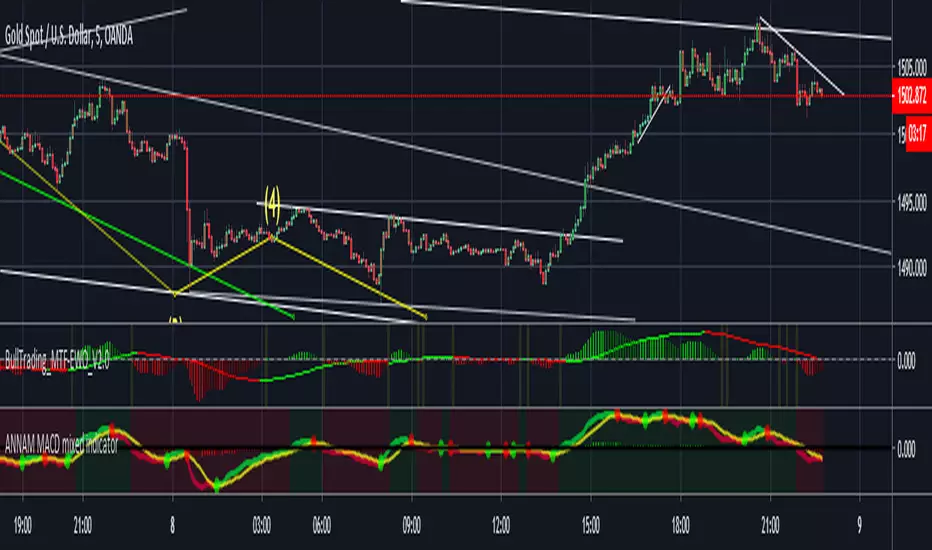
this version of the MACD indicator is 'trawling' (checking) if the MACD histogram and the zero line crossing with the MACD line are both positive or negative. The idea behind this is to show areas with higher or lower risk.
Features:
1. Enable the bar color
2. Enable the background color
3. Change zero line value
"The MACD-Histogram is an indicator of an indicator. In fact, MACD is also an indicator of an indicator. This means that the MACD-Histogram is the fourth derivative of price."
First derivative: 12-day EMA and 26-day EMA
Second derivative: MACD (12-day EMA less the 26-day EMA )
Third derivative: MACD signal line (9-day EMA of MACD )
Fourth derivative: MACD-Histogram ( MACD less MACD signal line)
Versionsinformation
update MacD Ult MTFVersionsinformation
Update plot nameVersionsinformation
update Alert when macd crossunder value -2 and crossabove value +2Versionsinformation
Update histogram EWOVersionsinformation
update sma2length 35 to 34Versionsinformation
Update color histogram EWO 2 to 4Frånsägelse av ansvar
Informationen och publikationerna är inte avsedda att vara, och utgör inte heller finansiella, investerings-, handels- eller andra typer av råd eller rekommendationer som tillhandahålls eller stöds av TradingView. Läs mer i Användarvillkoren.