INVITE-ONLY SCRIPT
Renko Dynamic Index
Uppdaterad
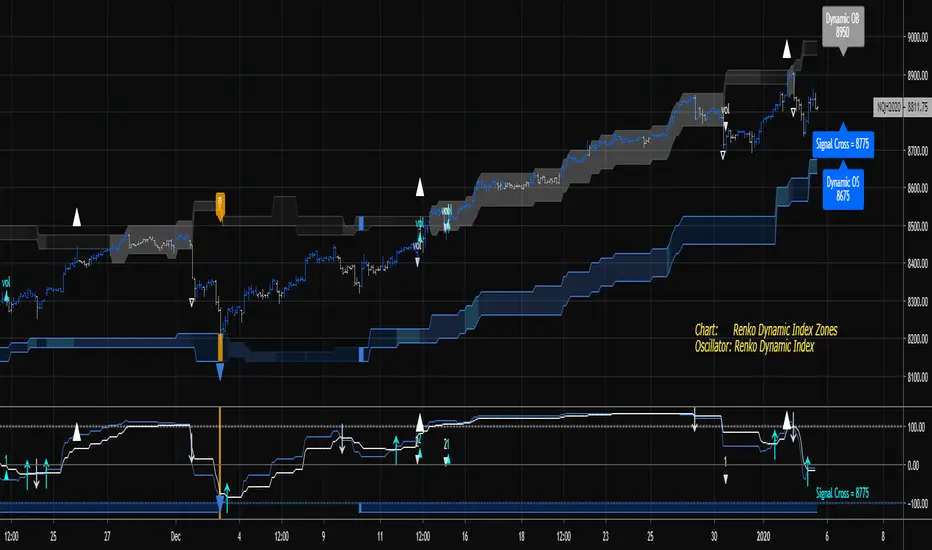
The goal of this indicator is to plot the Dynamic Index, Signal, and Histogram values "as if" the chart is a true price action based Renko chart. It can be used on a time series chart or Renko series chart. The Dynamic Index is derived from the raw price action of a time-based chart, where the historic and live price values are clustered into Renko bricks. The Renko brick production algorithm is entirely backed by Renko Overlay Ribbon and thoroughly tested. The Dynamic Index gets its inspiration from the Commodity Channel Index.
The algorithm takes into account rapid brick production within a single time candle and adjusts accordingly. The output may vary slightly between different chart time frames for the same indicator settings, but this is due to the lack of price fluctuation visibility that can occur in higher chart time frames. If the brick tick size is low, an appropriate chart interval should be selected that maximizes the amount of price volatility visible to the indicator. A bad setting would be something like a 1 tick EURUSD Renko setting on an H4 or Day chart, there simply is no way to derive the exact and ordered price fluctuations in a single candle, 1 pip at a time. A more appropriate chart time frame would be 1-5 minutes for this selected Renko brick size.
Please find the following video introduction helpful for this indicator and the Renko Dynamic Index Zones indicator:

If you are interested in the RSI-RENKO DIVINE™ Strategy please have a look here:

Contact me in Trading View or telegram for more information and access instructions.
The algorithm takes into account rapid brick production within a single time candle and adjusts accordingly. The output may vary slightly between different chart time frames for the same indicator settings, but this is due to the lack of price fluctuation visibility that can occur in higher chart time frames. If the brick tick size is low, an appropriate chart interval should be selected that maximizes the amount of price volatility visible to the indicator. A bad setting would be something like a 1 tick EURUSD Renko setting on an H4 or Day chart, there simply is no way to derive the exact and ordered price fluctuations in a single candle, 1 pip at a time. A more appropriate chart time frame would be 1-5 minutes for this selected Renko brick size.
Please find the following video introduction helpful for this indicator and the Renko Dynamic Index Zones indicator:
If you are interested in the RSI-RENKO DIVINE™ Strategy please have a look here:
Contact me in Trading View or telegram for more information and access instructions.
Versionsinformation
- Added trend change recognition algorithms. These can be toggled on/off by the check box "Show Trend Changes".
Versionsinformation
- Added logic for trend changes and trend pending changes.
- Added alerts for exit overbought, exit oversold, trend change up, trend change down, and trend change pending.
New Videos:
Video 2:

Video 3:

Versionsinformation
- Slight tweak to the trend change and trend direction algorithm.
Versionsinformation
- Fixed bug in trend direction algorithm.
Versionsinformation
- Updating trend change color fills matching the Dynamic Index Zones. You will see visuals now representing the trend algorithm that correlate to the Renko Zones script.
Versionsinformation
- Updated member features.
Find the edge.
Website: daily-edge.com
Twitter: twitter.com/dailyEdgeGroup
Youtube: youtube.com/c/TheDailyEdgeTradingGroup
Telegram: t.me/mortdiggiddy
Paypal: paypal.me/mortdiggiddy
Website: daily-edge.com
Twitter: twitter.com/dailyEdgeGroup
Youtube: youtube.com/c/TheDailyEdgeTradingGroup
Telegram: t.me/mortdiggiddy
Paypal: paypal.me/mortdiggiddy
Endast inbjudanskript.
Tillgången till detta skript är begränsat till användare som har godkänts av författaren och kräver vanligtvis betalning. Du kan lägga till det till dina favoriter men du kan bara använda det efter att ha begärt och fått författarens tillstånd. Contact mortdiggiddy for more information, or follow the author's instructions below.
Please note that this is a private, invite-only script that was not analyzed by script moderators. Its compliance to House Rules is undetermined. TradingView does not suggest paying for a script and using it unless you 100% trust its author and understand how the script works. In many cases, you can find a good open-source alternative for free in our Community Scripts.
Vill du använda det här skriptet i ett diagram?
Warning: please read before requesting access.
Frånsägelse av ansvar
Informationen och publikationerna är inte avsedda att vara, och utgör inte heller finansiella, investerings-, handels- eller andra typer av råd eller rekommendationer som tillhandahålls eller stöds av TradingView. Läs mer i Användarvillkoren.