OPEN-SOURCE SCRIPT
CofG Oscillator w/ Added Normalizations/Transformations
Uppdaterad
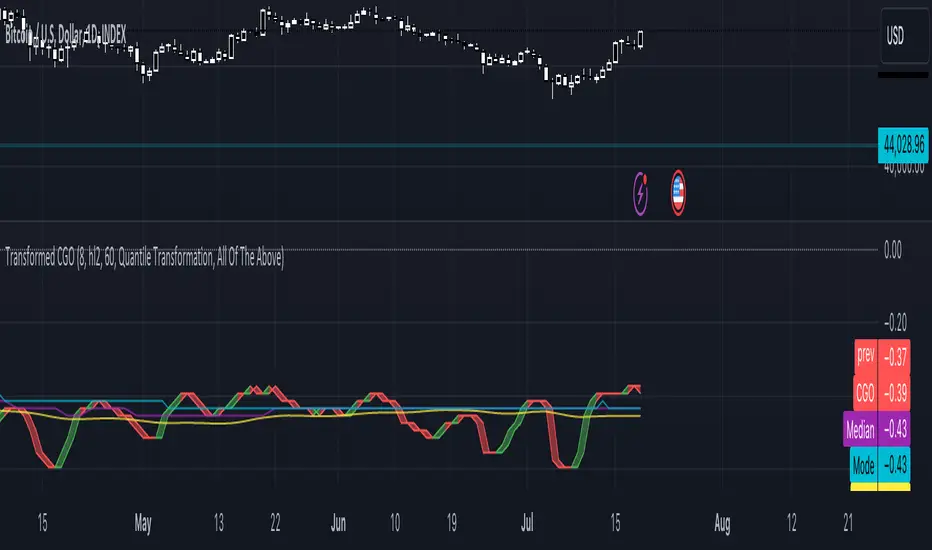
This indicator is a unique study in normalization/transformation techniques, which are applied to the CG (center of gravity) Oscillator, a popular oscillator made by John Ehlers.
The idea to transform the data from this oscillator originated from observing the original indicator, which exhibited numerous whips. Curious about the potential outcomes, I began experimenting with various normalization/transformation methods and discovered a plethora of interesting results.
The indicator offers 10 different types of normalization/transformation, each with its own set of benefits and drawbacks. My personal favorites are the Quantile Transformation, which converts the dataset into one that is mostly normally distributed, and the Z-Score, which I have found tends to provide better signaling than the original indicator.
I've also included the option of showing the mean, median, and mode of the data over the period specified by the transformation period. Using this will allow you to gather additional insights into how these transformations effect the distribution of the data series.
I've also included some notes on what each transformation does, how it is useful, where it fails, and what I've found to be the best inputs for it (though I'd encourage you to play around with it yourself).
Types of Normalization/Transformation:
1. Z-Score
2. Min-Max
3. Decimal Scaling
4. Mean Normalization
5. Log Transformation
6. Max Abs Scaler
7. Robust Scaler
8. Feature Scaling to Unit Norm
9. Logistic Function
10. Quantile Transformation
Conclusion
Feel free to explore these normalization/transformation techniques to see how they impact the performance of the CG Oscillator. Each method offers unique insights and benefits, making this study a valuable tool for traders, especially those with a passion for data analysis.
The idea to transform the data from this oscillator originated from observing the original indicator, which exhibited numerous whips. Curious about the potential outcomes, I began experimenting with various normalization/transformation methods and discovered a plethora of interesting results.
The indicator offers 10 different types of normalization/transformation, each with its own set of benefits and drawbacks. My personal favorites are the Quantile Transformation, which converts the dataset into one that is mostly normally distributed, and the Z-Score, which I have found tends to provide better signaling than the original indicator.
I've also included the option of showing the mean, median, and mode of the data over the period specified by the transformation period. Using this will allow you to gather additional insights into how these transformations effect the distribution of the data series.
I've also included some notes on what each transformation does, how it is useful, where it fails, and what I've found to be the best inputs for it (though I'd encourage you to play around with it yourself).
Types of Normalization/Transformation:
1. Z-Score
- Overview: Standardizes the data by subtracting the mean and dividing by the standard deviation.
- Benefits: Centers the data around 0 with a standard deviation of 1, reducing the impact of outliers.
- Disadvantages: Works best on data that is normally distributed
- Notes: Best used with a mid-longer transformation period.
2. Min-Max
- Overview: Scales the data to fit within a specified range, typically 0 to 1.
- Benefits: Simple and fast to compute, preserves the relationships among data points.
- Disadvantages: Sensitive to outliers, which can skew the normalization.
- Notes: Best used with mid-longer transformation period.
3. Decimal Scaling
- Overview: Normalizes data by moving the decimal point of values.
- Benefits: Simple and straightforward, useful for data with varying scales.
- Disadvantages: Not commonly used, less intuitive, less advantageous.
- Notes: Best used with a mid-longer transformation period.
4. Mean Normalization
- Overview: Subtracts the mean and divides by the range (max - min).
- Benefits: Centers data around 0, making it easier to compare different datasets.
- Disadvantages: Can be affected by outliers, which influence the range.
- Notes: Best used with a mid-longer transformation period.
5. Log Transformation
- Overview: Applies the logarithm function to compress the data range.
- Benefits: Reduces skewness, making the data more normally distributed.
- Disadvantages: Only applicable to positive data, breaks on zero and negative values.
- Notes: Works with varied transformation period.
6. Max Abs Scaler
- Overview: Scales each feature by its maximum absolute value.
- Benefits: Retains sparsity and is robust to large outliers.
- Disadvantages: Only shifts data to the range [-1, 1], which might not always be desirable.
- Notes: Best used with a mid-longer transformation period.
7. Robust Scaler
- Overview: Uses the median and the interquartile range for scaling.
- Benefits: Robust to outliers, does not shift data as much as other methods.
- Disadvantages: May not perform well with small datasets.
- Notes: Best used with a longer transformation period.
8. Feature Scaling to Unit Norm
- Overview: Scales data such that the norm (magnitude) of each feature is 1.
- Benefits: Useful for models that rely on the magnitude of feature vectors.
- Disadvantages: Sensitive to outliers, which can disproportionately affect the norm. Not normally used in this context, though it provides some interesting transformations.
- Notes: Best used with a shorter transformation period.
9. Logistic Function
- Overview: Applies the logistic function to squash data into the range [0, 1].
- Benefits: Smoothly compresses extreme values, handling skewed distributions well.
- Disadvantages: May not preserve the relative distances between data points as effectively.
- Notes: Best used with a shorter transformation period. This feature is actually two layered, we first put it through the mean normalization to ensure that it's generally centered around 0.
10. Quantile Transformation
- Overview: Maps data to a uniform or normal distribution using quantiles.
- Benefits: Makes data follow a specified distribution, useful for non-linear scaling.
- Disadvantages: Can distort relationships between features, computationally expensive.
- Notes: Best used with a very long transformation period.
Conclusion
Feel free to explore these normalization/transformation techniques to see how they impact the performance of the CG Oscillator. Each method offers unique insights and benefits, making this study a valuable tool for traders, especially those with a passion for data analysis.
Versionsinformation
Adjusted method of hardcoding the normal distribution array, original method was silly and inefficient. Adjusted titles slightlySkript med en öppen källkod
In true TradingView spirit, the author of this script has published it open-source, so traders can understand and verify it. Cheers to the author! You may use it for free, but reuse of this code in publication is governed by House rules. Du kan ange den som favorit för att använda den i ett diagram.
Frånsägelse av ansvar
Informationen och publikationerna är inte avsedda att vara, och utgör inte heller finansiella, investerings-, handels- eller andra typer av råd eller rekommendationer som tillhandahålls eller stöds av TradingView. Läs mer i Användarvillkoren.