Altice USA, Inc to print disturbing gains of 500% ??** For the active investor — weeks and months ahead **
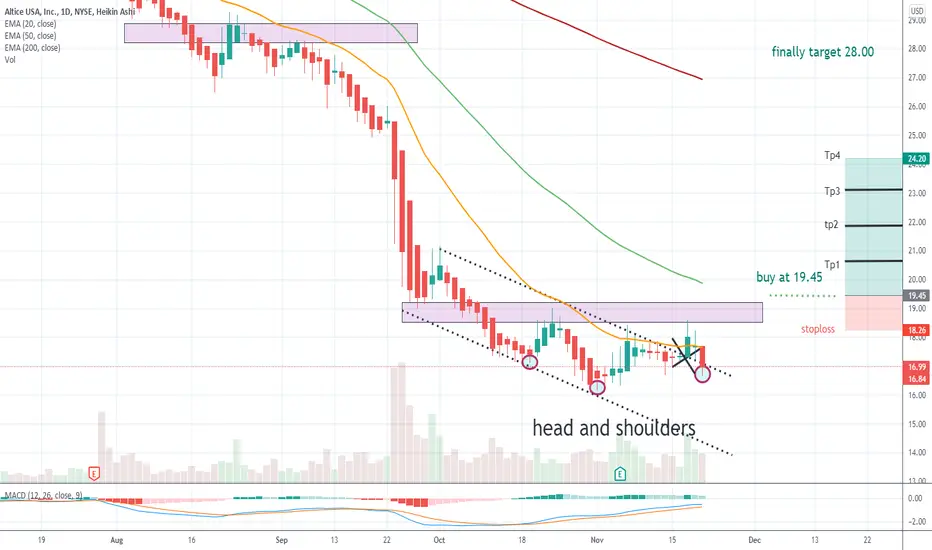
On the above 10 day chart price action has corrected 95% from $38 to $1.65 without the aid of stock splits. A number of reasons now exist to enter a long position. They include:
1) Price action and RSI resistance breakouts.
2) Support on past
Next report date
≈
July 30
Report period
Q2 2025
EPS estimate
−0.01 USD
Revenue estimate
2.15 B USD
−0.34 USD
−102.92 M USD
8.95 B USD
219.70 M
About Altice USA, Inc.
Sector
Industry
CEO
Dennis Mathew
Website
Headquarters
Long Island City
Founded
2001
FIGI
BBG00GFMPRK0
Altice USA, Inc. engages in the provision of broadband, pay television, telephony services, proprietary content, and advertising services. Its brands include Optimum, Suddenlink, Optimum Mobile, Altice Business, News 12 Networks, Cheddar News, a4 Advertising, and i24 News. The company was founded by Patrick Drahi in 2001 and is headquartered in Long Island City, NY.
−3.6%
−2.4%
−1.2%
0.0%
1.2%
Q1 '24
Q2 '24
Q3 '24
Q4 '24
Q1 '25
−800.00 M
0.00
800.00 M
1.60 B
2.40 B
Revenue
Net income
Net margin %
Revenue
COGS
Gross profit
Op expenses
Op income
Non-Op income/ expenses
Taxes & Other
Net income
−800.00 M
0.00
800.00 M
1.60 B
2.40 B
Revenue
COGS
Gross profit
Expenses & adjustments
Net income
−800.00 M
0.00
800.00 M
1.60 B
2.40 B
Q1 '24
Q2 '24
Q3 '24
Q4 '24
Q1 '25
−9.00 B
0.00
9.00 B
18.00 B
27.00 B
Debt
Free cash flow
Cash & equivalents
No news here
Looks like there's nothing to report right now


ATUS pushing the extremesNYSE:ATUS pushing the extremes of the 99.9% probability cone. Bids filled at $17.55.
Probability Cone is based on the Expected Move. While Expected Move only shows the historical value band on every bar, probability panel extend the period in the future and plot a cone or curve shape of the pro


See all ideas
Summarizing what the indicators are suggesting.
Neutral
SellBuy
Strong sellStrong buy
Strong sellSellNeutralBuyStrong buy
Neutral
SellBuy
Strong sellStrong buy
Strong sellSellNeutralBuyStrong buy
Neutral
SellBuy
Strong sellStrong buy
Strong sellSellNeutralBuyStrong buy
An aggregate view of professional's ratings.
Neutral
SellBuy
Strong sellStrong buy
Strong sellSellNeutralBuyStrong buy
Neutral
SellBuy
Strong sellStrong buy
Strong sellSellNeutralBuyStrong buy
Neutral
SellBuy
Strong sellStrong buy
Strong sellSellNeutralBuyStrong buy
Displays a symbol's price movements over previous years to identify recurring trends.
ALLVF4855435
CSC Holdings, LLC 5.75% 15-JAN-2030Yield to maturity
34.59%
Maturity date
Jan 15, 2030
ALLVF5177695
CSC Holdings, LLC 5.0% 15-NOV-2031Yield to maturity
32.80%
Maturity date
Nov 15, 2031
ALLVF4997185
CSC Holdings, LLC 4.625% 01-DEC-2030Yield to maturity
32.31%
Maturity date
Dec 1, 2030
ALLVF4791416
CSC Holdings, LLC 7.5% 01-APR-2028Yield to maturity
22.18%
Maturity date
Apr 1, 2028
ALLVF5177693
CSC Holdings, LLC 4.5% 15-NOV-2031Yield to maturity
14.70%
Maturity date
Nov 15, 2031
ALLVF4402915
CSC Holdings, LLC 5.5% 15-APR-2027Yield to maturity
14.61%
Maturity date
Apr 15, 2027
ALLVF4997187
CSC Holdings, LLC 4.125% 01-DEC-2030Yield to maturity
14.31%
Maturity date
Dec 1, 2030
ALLVF5025369
CSC Holdings, LLC 3.375% 15-FEB-2031Yield to maturity
14.23%
Maturity date
Feb 15, 2031
ALLVF5736982
CSC Holdings, LLC 11.75% 31-JAN-2029Yield to maturity
13.89%
Maturity date
Jan 31, 2029
ALLVF4791459
CSC Holdings, LLC 6.5% 01-FEB-2029Yield to maturity
12.40%
Maturity date
Feb 1, 2029
USU2285XAZ9
CSC HOLDINGS 23/28 REGSYield to maturity
11.99%
Maturity date
May 15, 2028
See all ATUS bonds
Frequently Asked Questions
The current price of ATUS is 2.42 USD — it has decreased by −14.49% in the past 24 hours. Watch Altice USA, Inc. stock price performance more closely on the chart.
Depending on the exchange, the stock ticker may vary. For instance, on NYSE exchange Altice USA, Inc. stocks are traded under the ticker ATUS.
ATUS stock has fallen by −13.26% compared to the previous week, the month change is a 5.68% rise, over the last year Altice USA, Inc. has showed a 18.63% increase.
We've gathered analysts' opinions on Altice USA, Inc. future price: according to them, ATUS price has a max estimate of 5.00 USD and a min estimate of 1.00 USD. Watch ATUS chart and read a more detailed Altice USA, Inc. stock forecast: see what analysts think of Altice USA, Inc. and suggest that you do with its stocks.
ATUS reached its all-time high on Dec 30, 2020 with the price of 38.30 USD, and its all-time low was 1.52 USD and was reached on Aug 9, 2024. View more price dynamics on ATUS chart.
See other stocks reaching their highest and lowest prices.
See other stocks reaching their highest and lowest prices.
ATUS stock is 24.12% volatile and has beta coefficient of 0.46. Track Altice USA, Inc. stock price on the chart and check out the list of the most volatile stocks — is Altice USA, Inc. there?
Today Altice USA, Inc. has the market capitalization of 1.13 B, it has increased by 3.02% over the last week.
Yes, you can track Altice USA, Inc. financials in yearly and quarterly reports right on TradingView.
Altice USA, Inc. is going to release the next earnings report on Jul 30, 2025. Keep track of upcoming events with our Earnings Calendar.
ATUS earnings for the last quarter are −0.16 USD per share, whereas the estimation was −0.07 USD resulting in a −129.79% surprise. The estimated earnings for the next quarter are −0.01 USD per share. See more details about Altice USA, Inc. earnings.
Altice USA, Inc. revenue for the last quarter amounts to 2.15 B USD, despite the estimated figure of 2.16 B USD. In the next quarter, revenue is expected to reach 2.15 B USD.
ATUS net income for the last quarter is −75.68 M USD, while the quarter before that showed −54.12 M USD of net income which accounts for −39.84% change. Track more Altice USA, Inc. financial stats to get the full picture.
As of May 19, 2025, the company has 10.9 K employees. See our rating of the largest employees — is Altice USA, Inc. on this list?
EBITDA measures a company's operating performance, its growth signifies an improvement in the efficiency of a company. Altice USA, Inc. EBITDA is 3.34 B USD, and current EBITDA margin is 37.87%. See more stats in Altice USA, Inc. financial statements.
Like other stocks, ATUS shares are traded on stock exchanges, e.g. Nasdaq, Nyse, Euronext, and the easiest way to buy them is through an online stock broker. To do this, you need to open an account and follow a broker's procedures, then start trading. You can trade Altice USA, Inc. stock right from TradingView charts — choose your broker and connect to your account.
Investing in stocks requires a comprehensive research: you should carefully study all the available data, e.g. company's financials, related news, and its technical analysis. So Altice USA, Inc. technincal analysis shows the strong sell today, and its 1 week rating is sell. Since market conditions are prone to changes, it's worth looking a bit further into the future — according to the 1 month rating Altice USA, Inc. stock shows the sell signal. See more of Altice USA, Inc. technicals for a more comprehensive analysis.
If you're still not sure, try looking for inspiration in our curated watchlists.
If you're still not sure, try looking for inspiration in our curated watchlists.