SPOT Weekly Options Trade — June 15, 2025🎧 SPOT Weekly Options Trade — June 15, 2025
💡 Ticker: SPOT
🎯 Strategy: Bullish Swing — Call Option
📅 Expiry: June 20, 2025
⏱ Entry Timing: Market Open
📈 Confidence: 70%
🔍 Analysis Summary
All four models (Grok, Llama, Gemini, DeepSeek) indicate strong bullish momentum on SPOT based on:
✅ Above all key EMAs (5-min and daily)
🔁 Bullish RSI, MACD, and Bollinger Band alignment
📢 Catalyst: Evercore ISI upgrade to $750
📊 Notable call open interest in OTM strikes
⚠️ Max Pain: $665 — a known drag, but outweighed short-term by momentum and the upgrade catalyst.
✅ Recommended Trade
🛒 Trade Type: Long CALL (Naked)
🎯 Strike: $740
💵 Entry Price: ~$4.25
📅 Expiry: June 20, 2025 (Weekly)
📈 Profit Target: ~$8.50 (100% gain)
🛑 Stop Loss: ~$2.10 (50% loss)
🔍 Why $740? It's the sweet spot between DeepSeek’s speculative $780 and Grok's expensive $725—offering leverage with decent odds.
⚠️ Risks & Watchouts
🧲 Max Pain gravity at $665 — may cap gains closer to expiry
📉 Rejection at $714–$718 resistance range
🌪 Elevated VIX = potential for wide intraday swings
📏 Stick to small sizing (risking <2% of portfolio) due to premium volatility
🎯 Bottom Line: Strong bullish setup, solid catalyst, and technicals support a move higher. Enter on strength near open, manage tightly, and take profits on a double.

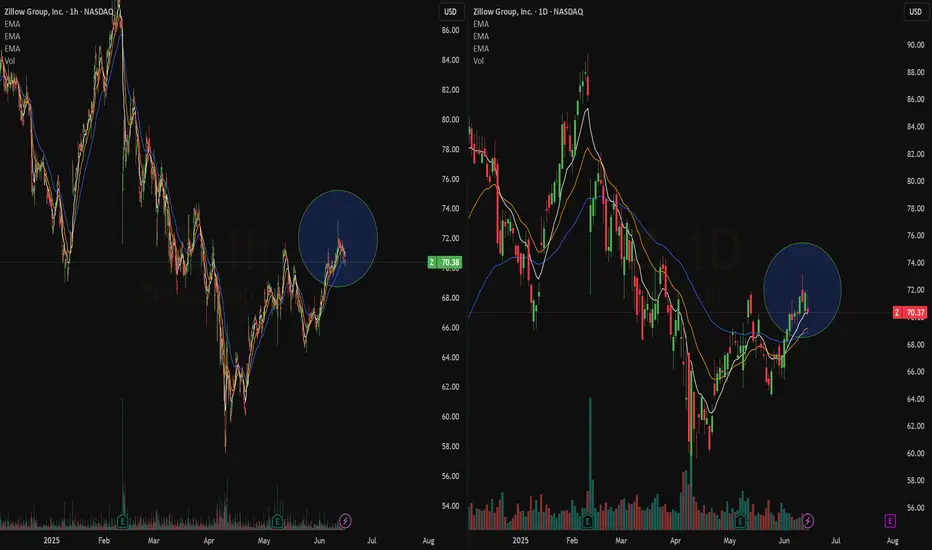
Quick View: $Z- Bullish Crossover on the daily chart, Bullish wave on the hourly chart.
- Some more volume would be good to support a new action to create new highs
IONQ - Is quantum computing worth investing for future?Hello Team,
Do you think Quatum Computer Stocks makes you Millioner :)
I will Publish some analysis for some Quantum Computer stocks today.
First one is IONQ:
All Quantum stocks are still so volatile but i see really good opportunities in daily bases for both side (Long / Short).
But i will make a daily chart analysis.
So , for the time being it is stucked between 41.50 to 37.00.
First resistent level is in 41.50 and support level 36.50 - 37.00.
Second resistant level is in 48.00 and i beleive that if it breaks this level and stay 3 days above this level it can reach the 56.00 soon.
If it goes down i think 32.00 - 32.50 level could be a good entry point.
My long term expectetion in One year maybe less it can be reach the 80.00 Level.
IONQ has made significant strides in scaling its quantum systems.
Lately They announced the acquisition of UK-based Oxford Ionics for approximately $1.1 billion.
Also IonQ and NVIDIA have partnered to advance hybrid quantum-classical computing. This collaboration integrates IonQ’s trapped-ion quantum processors with NVIDIA’s CUDA-Q platform, enabling powerful workflows that combine quantum and classical computation.
So i would like to be a early investor and beginning of this year i started increase my positions some Quatum computing stocks and IONQ is one of them.
This is just my thinking and it is not invesment suggestion , please do not make any decision with my anaylsis.
Have a lovely Sunday to all.

DASH Weekly Options Trade — June 15, 2025📈 DASH Weekly Options Trade — June 15, 2025
💡 Ticker: DASH
🎯 Strategy: Bullish Swing — Call Option
📅 Expiry: June 20, 2025
⏱ Entry Timing: Market Open (only if breakout confirmed)
📈 Confidence: 70%
🔍 Analysis Summary
All four models (Grok, Llama, Gemini, DeepSeek) point to short-term bullish momentum with DASH currently trading:
🔼 Above key EMAs on the 5-min and daily charts
🧭 MACD & RSI in bullish alignment
💬 Supported by strong volume and market sentiment
While there is caution due to overbought RSI and a wide gap between price and max pain ($187.50), the models favor a breakout scenario if DASH clears resistance at $219–$220.
✅ Trade Recommendation
🛒 Trade Type: Long CALL (Naked)
🎯 Strike: $230.00
💵 Entry Price: ~$0.67
📅 Expiration: June 20, 2025 (weekly)
📈 Profit Target: ~$1.34 (100% gain)
🛑 Stop Loss: ~$0.33 (50% loss)
🔎 Entry Note: Only enter if price confirms breakout above $219–$220 zone at open
🧠 Key Risks to Monitor
❗ Overbought signals could lead to a pullback before continuation
⚖️ Max pain at $187.50 may pressure price toward expiration
📉 Avoid entry if DASH fails to hold above $219 at open
🔄 Wider bid/ask spreads due to volatility—manage slippage carefully
🚨 Watchlist Trade: This setup is conditional. Enter only on breakout confirmation above $220.
Let’s see if DASH delivers another leg up—or stalls at resistance.

EL (Estée Lauder) Swing Trade Setup — June 15, 2025🔻 EL (Estée Lauder) Swing Trade Setup — June 15, 2025
💡 Ticker: EL
📉 Setup Type: Bearish Swing — Weekly PUT
📅 Expiry: June 20, 2025
⏱ Entry Timing: At Market Open
💬 Confidence: 70%
🧠 Model Insights & Technical Context
Across the board, our four AI models (Grok, Llama, DeepSeek, Gemini) provide the following signals:
✅ Short-Term Weakness:
Price is below all key EMAs (5-min and daily charts).
RSI is low (~30), near oversold but not reversing yet.
MACD is bearish and gaining downward momentum.
✅ Options Sentiment:
Very heavy put open interest at the $65 strike (4,935 contracts).
Max pain at $70 suggests potential price drag upward, but not immediate.
⚠️ Risk Flags:
Oversold conditions might cause a short-term bounce.
Gemini model recommends a $70 call if price holds support at open.
News risk remains (e.g., the death of Leonard Lauder) and volatility is rising (VIX ↑).
✅ Recommended Trade
💼 Strategy: Naked PUT (short bias)
🎯 Strike: $65.00
🕰 Entry Price (Limit): ~$0.65
🎯 Profit Target: ~$0.97 (≈+50%)
🛑 Stop Loss: ~$0.33 (≈–50%)
📆 Expiration: June 20, 2025
📈 Confidence Level: 70%
This setup reflects the dominant bearish view with strong technical momentum and favorable OI at the $65 strike. The trade benefits from liquidity and an attractive risk/reward skew.
🔍 Key Considerations
⚠️ If EL bounces sharply at open and holds above ~$67.30, the Gemini model’s call trade may activate. Monitor early action closely.
📊 News risk and market volatility may distort option pricing. Manage size and slippage carefully.
📉 If price reverses and breaks above $68.50, bearish thesis is invalidated.
💬 What’s your move on EL this week? Bearish into expiration or expecting a mean-reversion bounce?
Drop your thoughts 👇 or follow along in the QS trading room.

IONQ Swing Trade Alert – Bearish Setup Confirmed (June 15, 2025🐻 IONQ Swing Trade Alert – Bearish Setup Confirmed (June 15, 2025)
📉 Current Price: ~$37.84
📅 Expiry: June 27, 2025 | ⏱ Entry Timing: Market Open
📈 Trade Type: Bearish Swing via Naked PUT
🔍 Market Context & Technical Picture
All four AI models (Grok, Llama, Gemini, DeepSeek) agree: IONQ is in a short-term bearish phase, supported by clear technical breakdowns across the 15-minute and daily charts. While weekly trends remain bullish, immediate price action points lower:
📉 Price < EMAs on M15 and Daily
📉 Bearish MACD and weak RSI (low 30s)
📊 Rising VIX (~20.82) supports market-wide caution
🧲 Max pain at $39.00 = upside gravity, but unlikely to reverse trend in short term
🔻 Support zones: $36.00 – $35.50 range
✅ Trade Setup
💼 Strategy: Naked PUT
🔻 Strike: $37.00
🎯 Entry Price: ~$2.09 (mid of bid/ask: $1.94 / $2.24)
📊 Target: $3.14 (+50%)
🛑 Stop: $1.46 (–30%)
📆 Expiry: June 27, 2025
📈 Confidence: 75%
📉 Why This Trade?
✔ Consensus bearish across models
✔ Strong downside momentum on intraday/daily charts
✔ Option has decent liquidity (243 OI)
✔ Strike sits just under current price with tight R:R control
✔ Sector weakness and volatility support continuation
⚠️ Key Risks
🪫 Short-term RSI is oversold → minor bounce possible
💥 A sharp reversal above $39.50 invalidates the bearish thesis
📉 Wide spreads or poor fills → enter carefully at open
🎢 Rapid volatility spikes may distort option pricing
💬 Traders—What’s your read on IONQ?
Do you see it cracking $36 or rebounding from oversold?
Comment below 👇 or join the QS community for daily AI-generated signals.

IONQ - Possibility of a final phase wave C CorrectionIONQ seem to be starting final phase (Wave C) of downward correction. Breaking today's high would invalidate this wave C scenario as it's already extended a lot. Closing within the channel during this week would be preferable for this scenario. Wave C should take us to the red box.
Note: This is my first idea. Feel free to provide suggestions to improve.

A BULLISH SNAPCHAT ANALYSIS SNAPCHAT has a neat chart setup long term. Here is a bullish look. I use a metric called NJT which analyzes total user hours available.
From a technical standpoint, there are gaps up to $70, and it could soar much higher. Think longer term investment, with short term jump potential.
Here is my summarized view with a little help from Grok (X).
"Overview of Snap Inc.'s Assets and Valuation
Snap Inc., the parent company of Snapchat, is a publicly traded technology company listed on the NYSE under the ticker SNAP. Founded in 2011 by Evan Spiegel, Bobby Murphy, and Reggie Brown, it focuses on multimedia messaging, augmented reality (AR), and related products. Below, I outline Snap Inc.'s key assets, estimate their valuation based on available data, and apply the NJT (Net Joint Time) metric to contextualize its user engagement in the competitive landscape of 2025-2026. The NJT metric, defined as monthly active users (MAUs) × average time spent per user per month, is used to assess user hours, with the global pool estimated at 285.6 billion user hours per month (9.52 billion hours/day × 30 days).
Key Assets of Snap Inc.
Snap Inc. owns several products and services, with Snapchat being the flagship. Here’s a breakdown of its primary assets as of June 2025:
Snapchat (Core Multimedia Messaging App)
Description: Snapchat is a visual messaging app allowing users to send ephemeral photos and videos, with features like Stories, Snap Map, Discover, and AR Lenses. It generates most of Snap’s revenue through advertising, particularly AR ads and Snap Ads.
User Metrics: Approximately 900 million MAUs and 453 million daily active users (DAUs) as of Q4 2024, with users spending an estimated 30 minutes daily (15 hours/month).
NJT Calculation:
MAUs: 900 million
Average time spent: 15 hours/month
NJT = 900 million × 15 = 13.5 billion user hours/month
Valuation Estimate: Snapchat accounts for ~98% of Snap’s revenue ($5.26 billion of $5.36 billion in 2024). Assuming the company’s current market cap of $14.18 billion (June 2025) is primarily driven by Snapchat, we allocate ~98% of the market cap to this asset:
Value: $13.9 billion
Spectacles (AR Smart Glasses)
Description: Wearable sunglasses that capture Snaps and integrate with Snapchat, featuring GPS-powered AR lenses and hand-tracking capabilities. Launched in 2016, Spectacles have not gained widespread popularity but remain part of Snap’s AR vision.
User Metrics: Limited user data; estimated <1 million users with minimal time spent (assumed 1 hour/month for valuation purposes).
NJT Calculation:
MAUs: ~1 million (conservative estimate)
Average time spent: 1 hour/month
NJT = 1 million × 1 = 1 million user hours/month
Valuation Estimate: Spectacles contribute ~2% of revenue ($100 million in 2024). Using the same revenue-to-market-cap ratio as Snapchat, we estimate:
Value: $0.28 billion ($280 million)
Bitmoji (Personalized Avatar Platform)
Description: Acquired in 2016 for ~$64 million, Bitmoji allows users to create personalized avatars integrated into Snapchat and other platforms. It enhances user engagement but is not a direct revenue driver.
User Metrics: Assumed to align with Snapchat’s user base (900 million MAUs) but with lower engagement (estimated 2 hours/month).
NJT Calculation:
MAUs: 900 million
Average time spent: 2 hours/month
NJT = 900 million × 2 = 1.8 billion user hours/month
Valuation Estimate: As a feature enhancing Snapchat’s ecosystem, we estimate its value based on acquisition cost adjusted for inflation and integration (5% annual growth since 2016):
Value: ~$100 million
Snap Camera (Desktop Application)
Description: Launched in 2018, Snap Camera allows users to apply Snapchat filters during video calls on platforms like Zoom. It has niche usage, primarily for streaming and virtual meetings.
User Metrics: Limited data; estimated 10 million MAUs with 1 hour/month usage.
NJT Calculation:
MAUs: 10 million
Average time spent: 1 hour/month
NJT = 10 million × 1 = 10 million user hours/month
Valuation Estimate: Minimal direct revenue; valued as a brand enhancer at ~1% of Snapchat’s value:
Value: $140 million
Zenly (Location-Sharing App, Discontinued)
Description: Acquired in 2017 for an undisclosed amount (estimated $200-$300 million), Zenly was shut down in 2023, but its location-sharing features were integrated into Snap Map.
User Metrics: No independent users post-shutdown; value absorbed into Snapchat.
NJT Calculation: Not applicable (integrated into Snapchat’s NJT).
Valuation Estimate: Residual value in Snap Map enhancements, estimated at acquisition cost:
Value: ~$250 million
Other Assets (Content Partnerships, Snapchat+, R&D)
Description: Includes partnerships with NBCUniversal, Disney, and others for Snapchat Originals, the Snapchat+ subscription service (7 million subscribers in March 2024), and ongoing AR R&D. Snapchat-Az These contribute to revenue and engagement but are not separately quantified.
User Metrics: Snapchat+ has ~7 million users; other assets are part of Snapchat’s ecosystem.
NJT Calculation: Included in Snapchat’s NJT (13.5 billion hours/month).
Valuation Estimate: Snapchat+ and content partnerships generate ~$100 million annually (estimated); R&D is a cost center. Valued at ~2% of market cap:
Value: $280 million
Total NJT and Market Cap Projection
Total NJT:
Snapchat: 13.5 billion hours/month
Bitmoji: 1.8 billion hours/month
Snap Camera: 10 million hours/month
Spectacles: 1 million hours/month
Total: ~15.311 billion hours/month
Market Share: 15.311 ÷ 285.6 ≈ 5.36% of the global pool (285.6 billion hours/month).
Current Market Cap (June 2025): $14.18 billion
Projected Market Cap Using NJT: Assuming the total market cap of 45 companies (~$10 trillion) is distributed proportionally to NJT shares (as in prior conversations), Snap’s 5.36% share yields:
Projected Market Cap: $536 billion
Comparison: Significantly higher than the current $14.18 billion, suggesting Snap is undervalued based on user engagement.
Breakdown of Valuation by Asset
Asset
NJT (Billion Hours/Month)
Estimated Value ($B)
% of Total Value
Snapchat
13.5
13.9
98.0%
Spectacles
0.001
0.28
2.0%
Bitmoji
1.8
0.10
0.7%
Snap Camera
0.01
0.14
1.0%
Zenly (integrated)
-
0.25
1.8%
Other (Snapchat+, R&D)
-
0.28
2.0%
Total
15.311
14.18
100%
Key Insights
Snapchat Dominance: Snapchat accounts for 98% of Snap’s value and 88% of its NJT, driven by its 900 million MAUs and strong engagement among younger users.
Undervaluation: The projected market cap of $536 billion (based on NJT share) is significantly higher than the current $14.18 billion, suggesting Snap’s user engagement is not fully reflected in its stock price, possibly due to ongoing losses ($1.4 billion in 2022).
AR and Innovation: Investments in AR (Spectacles, Lenses) and Snapchat+ position Snap for growth in 2025-2026, particularly as AR advertising and immersive experiences gain traction.
Challenges: Competition from TikTok and Instagram Reels, privacy changes (e.g., Apple’s iOS updates), and macroeconomic swings in ad spending could limit growth.
Conclusion
Snap Inc.’s primary asset, Snapchat, drives its value and user engagement, with a projected market cap of $536 billion based on NJT, far exceeding its current $14.18 billion. This suggests significant undervaluation, driven by its strong user base and AR innovations, despite profitability challenges. Spectacles, Bitmoji, and other assets play smaller roles but enhance Snap’s ecosystem, positioning it as a top contender for 2025-2026.
Key Citations
Snap Inc. - Wikipedia
Who Owns Snapchat? - Famoid
Snapchat Revenue and Usage Statistics (2025) - Business of Apps
Snap (SNAP) - Market Capitalization - CompaniesMarketCap
Snapchat - Wikipedia
SNAP Intrinsic Valuation and Fundamental Analysis - Alpha Spread
Snap Inc. Announces Fourth Quarter and Full Year 2024 Financial Results - Snap Inc."
- GROK

Critical Point Price appears to be moving in an upward parallel channel. Now it is testing support at the bottom of the parallel channel. Price is also testing the 200 EMA (10.17). If the Bulls have their way price will go through the 10.70 price and then 11.00. If the Bears have their way price will drop to the 9.75 area and below. Let us see how price reacts around the 200 EMA.

APPLE WILL GO UP!Right now, 4th of April I'm standing in APPLE STORE THE GROVE LOS ANGELES
and I'm telling you - the price will turn around ASAP!
That's not financial advice

Another Key AreaPrice has returned to the 100 EMA at 14.01; will the Bulls have their way and pass 14.40 price and fill up the gap and test the 14.80 price area? Or will the Bears short away to the 200 EMA at 13.60?

LOADINGQBTS hasn't tested the 200 EMA since early May, now it is consolidating on it; also, on top of an unfilled price gap. The Bears would want for price break below the 14.70 200 EMA and fill the gap and test the 13.35 price area, bulls want price to break the trendline with volume and momentum and reach the 16.20 area and the 17.23 price area.

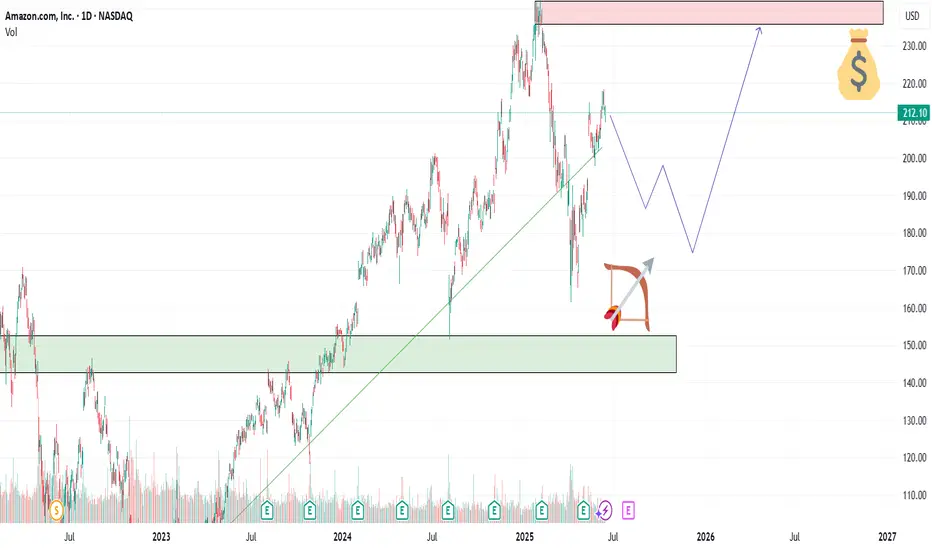
AMZN — Accumulation Zone or Just a Healthy Pullback?📦Amazon (AMZN) is offering an interesting opportunity after a healthy correction from its 2025 highs. With continued AWS expansion and aggressive investment in AI infrastructure, the fundamentals remain solid — but short-term volatility opens the door for strategic entries.
🎯 Entry Points
🔹 $194 – First key support, ideal for early buyers
🔹 $187 – Strong technical congestion zone
🔹 $169 – Deep value zone with higher risk/reward potential
💰 Profit Targets
✅ TP1: $210 – First resistance and psychological level
✅ TP2: $227 – Last swing high area
✅ TP3: $241+ – Full recovery path if momentum holds
🧠 Strategy Insight
This setup suits a swing trade horizon (30–60 days). Scaling into the position and adjusting stops under $160 offers a risk-managed approach. The upcoming earnings on July 31, 2025 could be the trigger for a major move — watch AWS growth numbers and forward guidance closely.
⚠️ Disclaimer: This analysis is for educational purposes only. It is not financial advice. Always do your own research and manage risk accordingly.
Decisions If HPE can move with volume and momentum above 17.70 price we can possibly have some bullish action towards the 18.00 price range, but if price fails the 17.52 price which is also the 200 EMA in orange, we may have bearish price action towards the 17.00 price range.

WOOF Petco Health & Wellness Company Potential Bullish ReversalIf you haven`t sold WOOF before this major retracement:
WOOF Petco Health and Wellness Company has experienced a notable selloff recently, with its stock price declining to around $2.47 as of mid-June 2025. However, several fundamental and technical factors suggest that WOOF could be poised for a meaningful reversal and upside recovery in the near to medium term.
1. Attractive Valuation and Upside Potential
Despite the recent pullback, Petco’s stock is trading at a compelling valuation relative to its long-term growth potential.
Price forecasts for 2025 indicate an average target of approximately $3.55, representing a 43.7% upside from current levels.
More optimistic scenarios project highs up to $7.05 within this year, suggesting significant room for a rebound if market sentiment improves.
Long-term forecasts are even more bullish, with price targets of $14 by 2030 and as high as $77 by 2040, reflecting confidence in Petco’s strong market position and growth prospects.
2. Resilient Business Model in a Growing Pet Care Market
Petco operates in the resilient pet care and wellness industry, which benefits from secular trends such as increased pet ownership, premiumization of pet products, and growing consumer spending on pet health.
The company’s omni-channel approach—combining e-commerce with physical stores and veterinary services—positions it well to capture multiple revenue streams.
Petco’s focus on health and wellness services, including veterinary care and pet insurance, provides higher-margin growth opportunities that can drive profitability improvements.
3. Technical Signs of Stabilization and Potential Reversal
After the recent selloff, WOOF’s stock price has found some support near the $2.40–$2.50 level, with increased trading volumes indicating growing investor interest.
The stock’s recent modest gains and stabilization suggest that selling pressure may be easing, setting the stage for a potential technical rebound.
Options market activity and analyst upgrades reflect improving sentiment.
4. Improving Operational Execution and Financial Health
Petco has been investing in expanding its veterinary services and digital capabilities, which are expected to contribute to revenue growth and margin expansion.
The company’s recent earnings calls and financial reports highlight progress in cost management and customer engagement initiatives.
Strong cash flow generation and manageable debt levels provide flexibility to invest in growth and weather macroeconomic uncertainties.
5. Market Sentiment and Analyst Support
While some analysts remain cautious, the overall sentiment is shifting toward a more constructive outlook, with several price target upgrades and “hold” to “buy” rating adjustments.
The combination of attractive valuation, improving fundamentals, and sector tailwinds is likely to attract renewed institutional interest.

WULF TeraWulf Leader in Clean Crypto Mining & HPC InfrastructureIf you haven`t bought WULF before the rally:
Now TeraWulf WULF is emerging as a compelling growth story in the digital infrastructure and cryptocurrency mining sectors, distinguished by its commitment to zero-carbon energy and expanding high-performance computing (HPC) hosting capabilities. Despite near-term financial challenges, the company’s rapid capacity growth, strong cash position, and strategic initiatives position it well for substantial upside in 2025 and beyond.
1. Rapid Expansion of Mining Capacity and Hashrate Growth
TeraWulf energized Miner Building 5, increasing its total mining capacity to 245 MW and boosting its Bitcoin mining hashrate to 12.2 exahashes per second (EH/s), a 52.5% increase year-over-year.
This significant growth in self-mining capacity enhances revenue potential and operational scale, positioning TeraWulf among the more efficient and sizable clean-energy miners.
The company’s vertically integrated model, powered primarily by zero-carbon energy, aligns with increasing regulatory and investor demand for sustainable crypto mining.
2. Strategic Buildout of High-Performance Computing (HPC) Infrastructure
TeraWulf commenced the buildout of dedicated HPC data halls and remains on track to deliver 72.5 MW of gross HPC hosting infrastructure to Core42 in 2025.
The company is actively pursuing additional HPC customers, targeting 200–250 MW of operational HPC capacity by the end of 2026, which diversifies revenue streams beyond crypto mining.
HPC infrastructure is a high-growth segment driven by demand for AI, big data, and cloud computing, offering TeraWulf exposure to secular technology trends.
3. Strong Financial Position and Capital Allocation
As of March 31, 2025, TeraWulf held approximately $219.6 million in cash and bitcoin holdings, providing liquidity to fund expansion and weather market volatility.
The company has repurchased $33 million of common stock in 2025, signaling management’s confidence in the business and commitment to shareholder value.
While total outstanding debt is around $500 million, TeraWulf maintains a strong current ratio (~5.4), indicating solid short-term liquidity.
4. Industry-Leading Sustainability Profile
TeraWulf’s focus on zero-carbon energy for its mining operations differentiates it in an industry increasingly scrutinized for environmental impact.
This green positioning not only appeals to ESG-conscious investors but may also provide access to incentives, partnerships, and preferential contracts as governments and enterprises emphasize sustainability.
5. Revenue Growth Outlook and Market Opportunity
Despite a temporary revenue dip to $34.4 million in Q1 2025, the company is projected to deliver a 53% increase in revenue for the full year 2025, significantly outpacing industry averages.
The combination of expanding mining capacity and HPC hosting services positions TeraWulf to capitalize on the growing demand for digital infrastructure powered by clean energy.
6. Navigating Financial Challenges with Growth Focus
TeraWulf reported a GAAP net loss of $0.16 per share in Q1 2025, reflecting ongoing investments in capacity and infrastructure.
Operational cash flow remains positive and improving, with management focused on scaling efficiently and improving margins over time.

Tesla (TSLA) 1H Chart – Wyckoff Cycle in ActionThis chart reflects a textbook Wyckoff pattern unfolding on TSLA’s 1-hour timeframe:
🔹 Accumulation Phase observed early May
🔹 Followed by Manipulation & Distribution – classic trap before markdown
🔹 Sharp selloff led to another Accumulation zone around $305
🔹 Further manipulation wicks indicate smart money involvement
🔹 Now projecting a move towards $360–$370 distribution zone
📌 Structure breakdown:
Smart Money Accumulation ➡️ Manipulation ➡️ Distribution
Bullish momentum building from $306 support
Eyes on reaction near the marked green distribution box 📦
📅 As of June 15, 2025 – chart aligns with Wyckoff theory and institutional behavior.

U Unity Is the Leader Powering the Mobile Gaming Boom in 2025If you haven`t bought the dip on U:
Now you need to know that U Unity Software stands as the dominant platform for mobile game development, fueling one of the fastest-growing segments in the global gaming industry. As mobile gaming continues its explosive expansion, Unity’s leadership in providing an accessible, powerful, and cross-platform game engine positions it for substantial growth and sustained market dominance in 2025 and beyond.
1. Unity Powers Over 70% of Mobile Games Worldwide
Unity is the engine behind more than 70% of all mobile games, a staggering market share that underscores its ubiquity and developer preference in the mobile gaming space.
This dominant position is supported by Unity’s user-friendly interface that appeals to a broad spectrum of developers—from indie studios to AAA game creators—enabling rapid prototyping and high-quality game production.
The company’s “build once, deploy anywhere” approach allows developers to launch games seamlessly across iOS, Android, consoles, and emerging platforms like AR/VR, saving time and development costs.
2. Mobile Gaming Market Growth Fuels Unity’s Expansion
The global mobile gaming market is projected to grow by $82.4 billion from 2025 to 2029, at a CAGR of 11.3%, driven by rising smartphone penetration, 5G connectivity, and increasing demand for multiplayer and free-to-play games.
Unity’s platform is uniquely positioned to capture this growth, as 90% of developers surveyed in 2025 reported launching their games on mobile devices.
The Asia-Pacific (APAC) region, accounting for over half of the mobile gaming market, represents a key growth area where Unity’s tools are widely adopted.
3. Cutting-Edge Technology and Innovation in Gaming Development
Unity’s continuous innovation, including the release of Unity 6 and Unity Vector, supports developers with advanced rendering, AI-driven content creation, and enhanced networking tools for smoother multiplayer experiences.
The platform’s integration of AI enables real-time, player-driven experiences such as dynamic content and adaptive storylines, which are becoming industry standards in 2025.
Unity’s cloud-based services and analytics empower developers to optimize monetization strategies, balancing user experience with in-app purchases and rewarded ads, which are booming in hybrid-casual games.
4. Thriving Developer Ecosystem and Support Network
Unity boasts a massive and active developer community, with over 8,000 companies worldwide adopting its platform for game development.
The Unity Asset Store and extensive tutorials reduce development time and costs, enabling faster time-to-market and innovation cycles.
This ecosystem fosters collaboration and accelerates problem-solving, making Unity the preferred choice for both startups and established studios.
5. Strong Financial Performance and Market Position
In Q1 2025, Unity reported revenue of $435 million with an adjusted EBITDA margin of 19%, reflecting operational discipline and strong demand for its platform.
Despite a GAAP net loss, Unity’s positive adjusted earnings per share ($0.24) and growing free cash flow demonstrate improving profitability metrics.
Unity’s leadership in mobile game development and expanding footprint in AR, VR, and metaverse projects provide multiple avenues for future revenue growth.
6. Cross-Platform and Metaverse Growth Opportunities
Unity’s “build once, deploy anywhere” philosophy extends beyond gaming into virtual concerts, interactive worlds, and digital marketplaces, positioning the company at the forefront of the metaverse evolution.
Enhanced networking and cloud gaming capabilities enable high-quality experiences across devices, including mobile phones and AR glasses, broadening Unity’s addressable market.

APPLE: Long Signal with Entry/SL/TP
APPLE
- Classic bullish pattern
- Our team expects retracement
SUGGESTED TRADE:
Swing Trade
Buy APPLE
Entry - 196.46
Stop - 192.63
Take - 203.97
Our Risk - 1%
Start protection of your profits from lower levels
Disclosure: I am part of Trade Nation's Influencer program and receive a monthly fee for using their TradingView charts in my analysis.
❤️ Please, support our work with like & comment! ❤️

Bullish Thesis: Why Oscar Health OSCR Could Rally Strong in 2025Oscar Health, OSCR, a technology-driven health insurance company, is positioned for a significant stock price appreciation in 2025. Despite some mixed short-term sentiment, the long-term outlook and recent analyst forecasts suggest a potential rally that could more than double the current share price. Here’s why OSCR could be a compelling bullish opportunity this year:
1. Strong Analyst Price Targets Indicate Upside of Over 125%
According to recent forecasts, OSCR is expected to reach an average price of $31.40 in 2025, with some analysts projecting highs as much as $41.31—a potential upside exceeding 125% from the current price near $13.95.
Monthly forecasts show a steady upward trajectory, with July 2025 targets around $37.24 and December 2025 targets near $34.67, highlighting sustained bullish momentum throughout the year.
The average 12-month price target is around $34.40, representing a 146% upside, signaling strong confidence in OSCR’s growth prospects.
2. Innovative Business Model and Growth Potential
Oscar Health leverages technology and data analytics to offer user-friendly, transparent health insurance plans, differentiating itself in a traditionally complex industry.
Its focus on member engagement, telemedicine, and cost-effective care management positions it well to capture market share as healthcare consumers increasingly demand digital-first solutions.
The company’s expanding footprint in both individual and Medicare Advantage markets provides multiple growth avenues.
3. Long-Term Vision and Market Opportunity
Beyond 2025, forecasts remain highly bullish, with OSCR projected to reach $53.77 by 2027 and nearly $100 by 2030, reflecting strong secular growth potential in the health insurance and digital health sectors.
Analysts see Oscar as a disruptive force with the potential to reshape healthcare delivery, driving substantial long-term shareholder value.
4. Improving Financial Metrics and Operational Execution
Oscar has been improving its loss ratios and operating efficiencies, which are critical for sustainable profitability.
The company’s investments in technology infrastructure and data-driven care management are expected to translate into better margins and revenue growth over time.
5. Market Sentiment and Analyst Ratings
While some platforms show mixed short-term sentiment, the dominant analyst consensus is a "Buy" or "Moderate Buy," supported by strong price targets and growth forecasts.
The stock’s current undervaluation relative to its growth potential creates a favorable risk-reward profile for investors.

AAOI Applied Optoelectronics potential rally by EOYApplied Optoelectronics AAOI is well-positioned for a strong rally toward $24 per share by the end of 2025, supported by multiple operational and strategic catalysts. A key recent development—the warrant agreement with Amazon—adds a powerful endorsement and financial backing that enhances the bullish case.
1. Amazon’s Strategic Warrant Agreement: A Major Vote of Confidence
On March 13, 2025, AAOI issued a warrant to Amazon.com NV Investment Holdings LLC, granting Amazon the right to purchase up to approximately 7.95 million shares at an exercise price of $23.70 per share.
About 1.3 million shares vested immediately, with the remainder vesting based on Amazon’s discretionary purchases, potentially up to $4 billion in total purchases over time.
This agreement signals Amazon’s strong confidence in AAOI’s technology and its critical role as a supplier of high-speed optical transceivers for Amazon Web Services and AI data center infrastructure.
The warrant price near $24 effectively sets a floor and a valuation benchmark, supporting the thesis that AAOI’s stock could reach or exceed this level by year-end.
2. Major Data Center Wins and Hyperscale Customer Re-Engagement
AAOI recently resumed shipments to a major hyperscale customer, with volume shipments of high-speed data center transceivers expected to ramp significantly in the second half of 2025.
This re-engagement with a key customer aligns with the surging demand for AI-driven data center infrastructure, providing a strong revenue growth catalyst.
3. Robust Revenue Growth and Margin Expansion
Q1 2025 revenue doubled year-over-year to nearly $100 million, with gross margins expanding to over 30%, reflecting operational efficiencies and favorable product mix.
The company expects to sustain strong quarterly revenue ($100–$110 million) and ramp production capacity to over 100,000 units of 800G transceivers per month by year-end, with 40% manufactured in the U.S.
4. Manufacturing Expansion and Supply Chain Resilience
AAOI is scaling manufacturing in the U.S. and Taiwan, enhancing supply chain robustness and positioning itself to benefit from potential government incentives for domestic production.
Its automated, largely in-house manufacturing capabilities provide a competitive edge in meeting hyperscale and AI data center demand.
In conclusion:
Amazon’s warrant agreement at a $23.70 strike price not only provides a direct valuation anchor near $24 but also serves as a powerful strategic endorsement of AAOI’s technology and growth prospects. Combined with robust revenue growth, expanding manufacturing capacity, and key customer re-engagement, AAOI has a compelling case to reach or exceed $24 per share by the end of 2025.

Why Recursion Pharmaceuticals RXRX Could Be the NVDA of BiotechRecursion Pharmaceuticals RXRX is rapidly emerging as a transformative force in drug discovery, leveraging cutting-edge artificial intelligence and automation to industrialize and accelerate the development of new medicines. Here’s why RXRX could be the next NVIDIA (NVDA) of biotechnology and why its stock could soar by year-end:
1. AI-Powered Drug Discovery Platform with Unmatched Scale
Recursion integrates AI, machine learning, automation, and advanced data science to decode biology and chemistry, dramatically reducing the time and cost of drug discovery.
The company’s proprietary BioHive-2 supercomputer, built with NVIDIA’s DGX H100 systems, is the most powerful AI computing system wholly owned by any biopharma company, enabling Recursion to process biological data at unprecedented speeds.
By reducing the number of compounds needed for clinical candidates from thousands to just 136–200 and shrinking development timelines to under a year, RXRX is fundamentally changing the economics of pharmaceutical R&D.
2. Strategic Partnerships and Industry Validation
RXRX has forged high-profile partnerships with pharmaceutical giants such as Bayer, Roche/Genentech, Takeda, and Sanofi, validating its platform and unlocking milestone payments that could exceed $20 billion over time.
The company’s collaboration with AI biotech Exscientia in a $700 million deal further cements its leadership in the AI-driven drug discovery space, creating a pipeline of 10 clinical and preclinical programs with hundreds of millions in potential milestones.
NVIDIA itself holds over 7.7 million shares of RXRX, making it one of NVIDIA’s largest biotech investments and a strong endorsement of Recursion’s technology and long-term vision.
3. Explosive Revenue Growth and Strong Cash Position
Analysts forecast Recursion’s revenue to grow at a 65% CAGR from $58.8 million in 2024 to $263 million by 2027, far outpacing the broader biotech sector.
The company ended 2024 with over $600 million in cash, providing a solid runway for continued investment in R&D, platform expansion, and clinical trials.
Wall Street analysts expect more than 50% upside in RXRX stock over the next 12–24 months, with multiple clinical milestones and partnership announcements as near-term catalysts.
4. Disruptive Vision: The “Virtual Cell” and Beyond
RXRX is building toward a “virtual cell,” where AI models can simulate biological processes with such accuracy that wet lab experiments shift from data generation to validating computational predictions.
This approach could dramatically improve drug development success rates, addressing the industry’s notorious 95% failure rate and positioning Recursion as the go-to platform for next-generation drug discovery.
5. Market Sentiment and Institutional Support
RXRX has caught the attention of growth investors and major funds, including Cathie Wood’s ARK Invest, further boosting its profile and liquidity.
Recent stock surges and high trading volumes reflect growing investor confidence in Recursion’s disruptive potential and the broader AI-in-biotech trend.

RGTI - Another Quatum Stock . Should i buy?Hello Everyone,
So last Quantum stock that i try to analyse today is RGTI - Rigetti Computing
First of all some figures for RGTI:
Revenue: $1.47 M — down 52% YoY and 36% QoQ
Operating Expenses: $22.1 M — up 22% YoY
Operating Loss: $21.6 M .
Net Income: +$42.6 M (+$0.15 eps) — driven by ~$62 M one-time non-cash gains .
Cash & Equivalents: ~$209 M as of Mar 31; ~$238 M by Apr 30 after $35 M investment from Quanta Government
Contracts:
DARPA Quantum Benchmarking Initiative Stage A, up to $1 M.
$5.5 M AFOSR award.
£3.5 M Innovate UK grants, including expansion of NQCC QPU from 24→36 qubits
Partnerships & Investments: $35 M strategic collaboration with Quanta Computer at ~$11.59/share
It's a high-risk, high-reward quantum play—valuable for those bullish on long-term quantum commercialization, but likely volatile near-term.
Chart Analysis:
For the time being it is stucked between 14.50 - 11.00 .
If it goes down to 9.00 $ level for me it could be the good opportunity to increase my positions.
14.15 - 14-30 is the resistance level and if this level are broken then it can quickly reach to 16.30 - 16.50 Levels.
Biggest resistance level is in 21.50 and if this level is broken then we can see 25.00 - 26.00 level very quickly.
My long term expectetion in One year maybe less it can be reach the 25.00 - 26.00 Level.
So Same as i mentioned for IONQ and QBTS , i would like to be a early investor and beginning of this year i started increase my positions some Quatum computing stocks and RGTI is one of them.
This is just my thinking and it is not invesment suggestion , please do not make any decision with my anaylsis.
Have a lovely Sunday to all.

QBTS - Is it worth Investing?Hello All,
As i mentioned my previous IONQ publishment , second Quantum Computer company is QBTS.
First of all some figures for QBTS:
Revenue: $15.0 million — up +509% year‑over‑year
Net Loss: $5.4 million (−$0.02 per share), improved from a $17.3 million loss in Q1 2024
Cash Resources: $304 million in cash and equivalents as of March 31 2025. That means that they have enough money to sustain company and to reach profitability.
Commercial Traction:
‣ Ford Otosan deployed a hybrid quantum application, cutting vehicle scheduling time by 83%
‣ Collaborations include Japan Tobacco (quantum-AI drug discovery), Davidson Technologies (U.S. on-site installation), and Jülich Supercomputing Centre
Chart Analysis:
When i look at the chart , i think now it is making a some correction to close gap between 13.50 to 14.60 (I marked it in chart) . If it reachs to 13.50 level i think it could be good entry level.
20.00 is biggest resitance level for now . If it will break this level and stay 3 days above this level next station could be between 23 and 24 .
My long term expectetion in One year maybe less it can be reach the 29.00 - 30.00 Level.
So Same as i mentioned for IONQ ; i would like to be a early investor and beginning of this year i started increase my positions some Quatum computing stocks and QBTS is one of them.
This is just my thinking and it is not invesment suggestion , please do not make any decision with my anaylsis.
Have a lovely Sunday to all.
