INVITE-ONLY SCRIPT
Liens Support and resistance + trend following
Uppdaterad
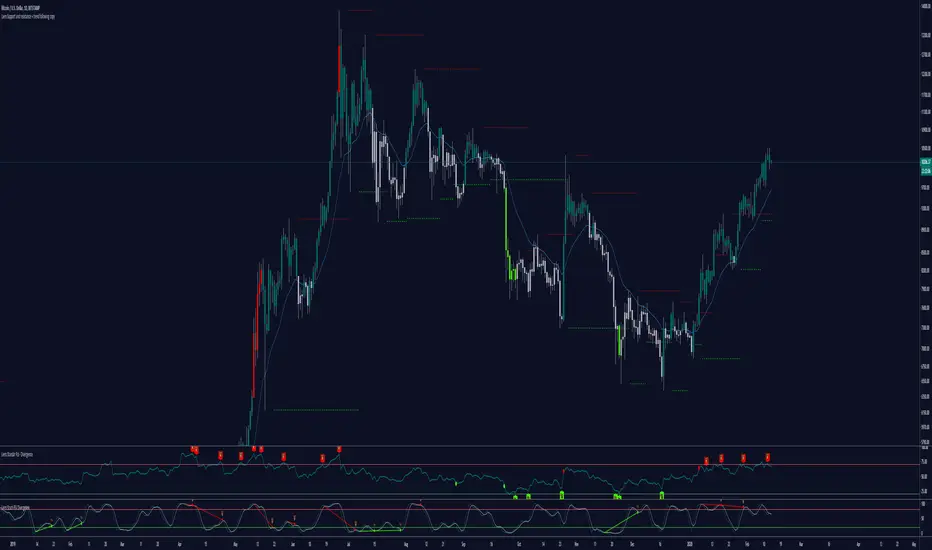
1. Two different support and resistance levels. One that focuses on price action and one for wicks. (Wicks needs to be turned on)
3. 20 ema trendfollowing. Bars change color. when price is over/under ema.
4. Bar color levels also work with rsi levels. Currently set to 0-100. If you only want bars to change color when the rsi is overbough/oversold. simply just change the levels to 70-30 or whatever you like :)
3. 20 ema trendfollowing. Bars change color. when price is over/under ema.
4. Bar color levels also work with rsi levels. Currently set to 0-100. If you only want bars to change color when the rsi is overbough/oversold. simply just change the levels to 70-30 or whatever you like :)
Versionsinformation
Had some issues with the rsi overbought/oversold bars not changing color.Now everything is working 100% :)
Versionsinformation
1. Green bars = price over 20 ema2. Red bars = price under 20 ema
3. blue bars = rsi overbought + price over 20 ema
4. white bars = rsi oversold + price under 20 ema
Versionsinformation
Color update.
Versionsinformation
.Endast inbjudanskript.
Tillgången till detta skript är begränsat till användare som har godkänts av författaren och kräver vanligtvis betalning. Du kan lägga till det till dina favoriter men du kan bara använda det efter att ha begärt och fått författarens tillstånd. Contact Bitcoinandyy for more information, or follow the author's instructions below.
TradingView does not suggest paying for a script and using it unless you 100% trust its author and understand how the script works. In many cases, you can find a good open-source alternative for free in our Community Scripts.
Vill du använda det här skriptet i ett diagram?
Warning: please read before requesting access.
Hey.
if you want access to this script shoot me a dm :)
if you want access to this script shoot me a dm :)
Frånsägelse av ansvar
Informationen och publikationerna är inte avsedda att vara, och utgör inte heller finansiella, investerings-, handels- eller andra typer av råd eller rekommendationer som tillhandahålls eller stöds av TradingView. Läs mer i Användarvillkoren.