Bitcoin Nu är korrektions vågen (Expanded flag) är äntligen klar! som ser ut för BTC kommer priset att öka kraftig mot 74k och sedan ner mot 50k-60k.
Hoppas ni gillar min vågrörelsebaserad analys!
handelsidéer för BTCUSDT.P

Omvänd Huvud & Skuldra Formation på BTC/USDTHär har ni en kort söndags analys och potentiell trade på 6% vinst:
Efter BTC's senaste rekyl så ser det ut som en Omvänd Huvud & Skuldra Formation med ett tekniskt target på ca $63700.
- EMA 50 pekar upp och närmar sig eventuellt inom några timmar en bullish cross på 200 EMA
På dagliga tidsramen ser det ut som BTC har bottnat och du har båda Stoch RSI som har korsat, RSI som pekar upp, MACD sälj trycket börjar avta och 50 & 200 EMA pekar uppåt.

Asymmetrisk Triangel på BTC 1 timmes - Utbrott Snart...På 1 timmes tidsramen kan man se att BTC formar ett assymetrisk triangel mönster som väntas bryta ut närmaste dagen eller två antingen till uppsidan eller nersidan.
Eftersom Assymetrisk Triangel är mer av ett fortsättning mönster så är det mer troligt att det bryter ner än upp eftersom trenden kortsiktigt är neråt fortfarande, det skulle även falla ihop med den tidigare huvud & skuldra tekniska target på runt $56-57k.
Bryter triangeln upp så har vi ett tekniskt target på runt $62800 vilket skulle vara ett styrke besked för tjurarna.
Vecko & Daglig analys
Nuvarande vecko stapeln ser rätt ful ut just nu med både RSI och Stoch RSI pekande neråt så finns utrymme för fortsatt nedgång. MA & EMA fortsatt uppåt.
Viktigt att 57800-58000 håller som support för fortsatt tjurmarknad, annars är chansen för en ny björn period stor där vi måste underhålla tanken att besöka lägra targets på 30-40 k igen eventuellt...
På dagliga tidsramen ser vi senaste Oktober low på runt $57800 är viktigt att priset inte går ner lägre än så för fortsätta denna bull run.
Stoch RSI håller på göra en kors och just nu ser 50 EMA hålla som support som talar för att vi kanske har bottnat och vända upp.

Falling Wedge Mot Huvud & Skuldra Formation på BTC 1 TimmesLite tankar kring BTC för närmaste tiden som kan bli volatil.
På BTC 1 timmes tidsram så kan man se att både en falling wedge formas och även en Huvud & Skuldra formation - En tjur formation mot ett mer björn mönster - vilken kommer vinna?
När det kommer till Huvud & Skuldra mönster på BTC så har de en ganska låg chans att spela ut om man tittar tillbaka senaste tiden så har BTC skapa flera Huvud & Skuldra formationer som visat sig bara bear traps för att sen fortsätta uppåt så det kan mycket väl vara så denna gång också.
Samtidigt skulle det inte vara ologiskt att det mönstret skulle spelas ut och gå ner och till det tekniska target på 64-63K där båda 200 EMA och 200 MA befinner sig just nu. Det var även kring $63,300 som vi fick en stark impulsiv rörelse så att priset kan gå ner och testa stödet där skulle vara logiskt enligt mig.
Om priset går över den högra skuldran så kan man nog säkerligen säga att det är falling wedgen som spelar ut med ett target på $68500 ca.
Vad tror ni? Kommentera gärna era tankar om ni vill :D

Stor Bull Flag på BTC Dagliga TidsramenBitcoin fortsätter sitt starka momentum och ser ut att spela ut sitt nästa drag i form av en enorm Tjur flagga med ett target på runt $84,000 vilket även är väldigt nära Golden Pocket Fib Extension 1.618 på runt $86,000.
Just nu ser utbrottet ur flaggans övre motstånds linje väldigt starkt och tror priset har en stor chans att nå Tjurflaggans target.
MACD dagliga håller på minskar i sitt säljtryck och ser ut att kunna ge en köp signal snart.
Stoch RSI har mycket rum för att fortsätta upp. Även RSI har momentum uppåt.
Personligen skulle jag lägga en stop loss runt 60-61k strax under flaggans övre motstånds linje vilket jag inte tror priset kommer gå ner till på ett tag och ta vinst längs vägen upp mot 80-85k.

Ny ATH på BTC snarast?Bitcoin har visat starkt stöd på 60k nivån sedan två veckor tillbaka. Åtta gånger har vi hittat stöd och fått en liten rekyl upp. Sedan föregående ATH har vi befunnit oss i en konsolideringsfas. Tittar vi på motstånd kan vi observera motstånd mellan 63,4k och 64k dollar och även vid föregående ATH.
På två timmars grafen är ett ''golden cross'' påväg att infinna sig, dvs, när MA50 bryter över MA200. Sedan föregående golden cross har kursen stigit med ca 30%.
Personligen tror jag vi får se en ny ATH inom kort.
Väl mött!

Bull Flag och Falling Wedge på BTC - $67K TargetHär är en kort analys av BTC på 1 timmes tidsramen som kan spela ut sig inom några dagar eventuellt.
På en timmes tidsram på BTCUSDT kan man se att priset brutit ut från en större falling wedge med ett tekniskt target på 67k och håller nu på konsoliderar på vad som ser ut som en möjlig bull flag, även den med ett tekniskt target på 67k.
Om man drar fib extension från senaste swing low till swing high så hittar du även 0.71 FIB på just 67k - så det är flera mönster och indikatorer som visar att vi eventuellt kan nå 65-67k ganska snabbt om vi får ett utbrott från tjur flaggan.
Igår gjorde 50 EMA en bullish kors på 200 EMA med stor volym bakom och för att bekräfta Bull Flag formation så behövs det ökad volym - kanske efter MACD och Stoch RSI har gett köp signal?
Efter $63700 så finns inte mycket motstånd som man kan se enligt synliga intervallen, når vi dit så tror jag att vi även når 65-67K.

Stor Huvud Skuldra Formation på BTC 4 timmars tidsram.Som det ser ut nu spelar BTC ut en Huvud & Skuldra formation med ett tekniskt target på ca $52800-53000.
Priset har redan vart över 12 timmar under nacklinjen och testar just nu 58k som support , tappar vi den nivån så är 56-54k nästa stopp . EMA ribbon har börjat korsa bearish vilket kan tyda på att denna formation kommer spelas ut men kanske inte ända till tekniska target.
September ATH var på 52 k vilket är väldigt nära det tekniska target för denna formation, så kan vara så att priset går ner och testar den nivån men tror att vi får en bounce tidigare än så.
Nivåer att kolla på genom Fibonacci retracement där priset eventuellt kan nå är 61,8 % retracement på $56916 och 50 % retracement på $53831.
Den synliga intervallen visar mycket volym runt $54-55 k så där finns mycket support . 200 MA är även på det priset så mycket möjligt att BTC kan gå ner och testa här. Gör den det tror jag vi får en stark bounce därifrån.
Tror inte denna Bull run är över för BTC och crypto utan en hälsosam pullback efter en 62 % uppgång på 20 dagar. Mycket av denna senaste tids uppgång har med stor sannolikhet vart ryktena om en BTC ETF som nu har blivit godkänd så en del har väl kanske "sell the news" efter ETF'nerna äntligen lanserats och kommer vi ner lite i pris öppnar det upp för nya köpare att komma in.
Stänger vi en daglig close under 60 k idag så tror jag att 55k är ett rimligt target vilket är ca -18 % från ATH vilket inte är så ovanligt för BTC, bara för över en månad sen i början av september såg vi priset falla från 52k ner till 42k på en dag - ca - 20 %.
Detta kan också vara en bear trap och att vi går upp igen och når vi över $62500 så är det troligt med en ny ATH inom kort enligt mig.
Jag har även lagt till Elliot Wave counts med ABC korrection och 5 vågor upp följt av en potentiell ABC korrektion som jag lagt på sidan om högra skuldran för det ska synas - nu är jag ingen Elliot wave expert men om det är någon som har den kunskapen får du gärna lägga en kommentar vad du tycker om den räkningen eller vad du tror om denna Huvud Skuldra formation :)

BTC/USDT Upprepande mönsterPlacerat en kopia av föregående bullrun, spännande att se om och hur långt det korrelerar. Inte första gången bitcoin upprepar tydliga mönster. Ide nr1, år 1 i tradingvärlden, uppskattar konstruktiv kritik.

Huvud & Skuldra Formation på BTC Daglig Time FramePotentiell Head and Shoulders Formation på BTC på Daily. Just nu ser det ut som priset testar högra axelns nack linje på ca $44500, om vi får en rejection där så kan mycket väl denna Huvud Skuldra formation spela ut med ett target på ca $36000 vilket också skulle komma nära 0.236 Fibonnaci extension.
På vecko time frame så visar Stoch RSI att det finns rum för mer retracement nästkommande veckor för BTC och likaså MACD på vecko ramen ser ut korsa ner.
Det som talar upp för BTC är nyligen en tweezer bottom, Stoch RSI på dagliga och 3 dagars visar rum för uppsida, och så den efterlängtade Golden Cross fast den inte är så stark som det ser ut just nu.
På 3 dagars visar MACD fortarande rött och likaså på den dagliga har det ännu inte sålts av tillräckligt. 200 MA visar inte jättestarkt uppåt utan mer sidledes och lite aningen neråt.
Ni får göra eran egen bedömning om vad ni tror väger tyngst men jag tror mer på en rejection härifrån och ner till lägre nivåer är mer sannolik och i så fall ett bra köp läge möjligen :)

Uppdaterad kort position ner mot likviditetsbyggetJa, så här går det när man tittar på TV i soffan och inte hör när larmet går. Å andra sidan skall man ju ta helg också, men det går ju som sagt inte med krypto.
Det som hände var att jag missade en "Close below structure" med $400. Gick kort så sent som 49768.
Kan redan nu säga att det var ett dåligt trade eftersom jag frångick min tänkta setup.
Hursomhelst. Insatsen är tagen på 1/4 av kontot för att hålla ner risken på 1%.
* 1:a postionen står för halva insatsen med RR:1:2
* 2:a och 3:dje positionen för en 1/4 vardera på RR: 1:3.6 samt 1:7.5
Stoplossen är svag med 2ATR+lite extra för att hamna ovanför zonen.
Det har byggt på med lite strukturer sen sist, vilket kompenseras med aggressiv trailing:
Så fort kursen bryter ner i strukturen sätts att alla 3 positionernas SL till RR: 1:1 och trailngen börjar.
Trailing-nivåerna är utmarkerade med lila pilar. När kursen bryter en nivå sätts SL till nivån ovanför.

Kort position hela vägen ner mot likviditetsbyggetBTC närmar sig $50k, vilket inte bara är ett magiskt tal utan även botten på en Daglig Sekundär Strukturell Supply-zon som formades den 14:e maj -21.
Positionen tas med
Entry med bearish candle-formationer på 1h. (T.ex Engulfing, Evening Star, 3 Inside Down)
SL = 2*ATR(14) från 4h
Target på R:R=1:3
4 timmars ATR ligger just nu runt $1000, så ca $2000 ovanför Entry. Önskvärt om Entryt tas så att Stoplossen hamnar ovanför strukturerna till vänster.
Risken hamnar på 3.97% för att få risken till 1% så används maximalt 25% av kontot i positionen.
Target:
Med anledning av denna idé , där hypotesen är att nuvarande uppgång kan ha sin grund i skatteflykt, snarare än optimism, så siktar jag här på att traila en djupare korrektion.
1:3 hamnar betryggande ovanför senaste strukturen. Här släpper vi 50% positionen och börjar genast traila resten från 1:1.
Trailen tas mot en zon som beskrivs i denna idé:
Fibonacci retracement mäts upp från supply-zonen mot "demand"-zonen.
Vid 1:6 som infaller strax innan struktur till vänster och innan Fib.Retr. 61.8% släpper jag 25% av positionen.
Vid ca 1:8 som infaller strax innan Fib.Retr. 78.6% går jag ur helt.
Stoploss på $2000 känns galet... men kom ihåg att justera risken med insatsens storlek.
Trade safe!
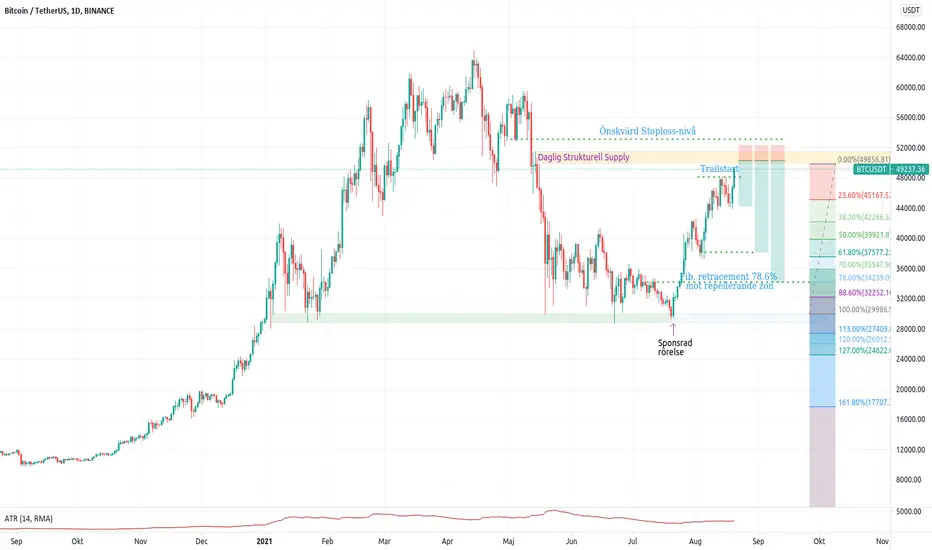
Sponsrad rörelse förvandlar stöd till demand-zonSedan januari-21 har det funnits en tydlig stöd-zon kring $29-$30. Det handlar i huvudsak om spikar som vänder kursen. Ända från daglig och ner på 1h handlar det om kraftiga reppellationer i "spikformat".
Men 20-21 juli, då det såg ut såhär på
4h:
1h:
Det här liknar en sponsrad rörelse och de likviditetsbyggen man letar efter i FX-marknaden. Inga småsparare kan hålla kvar kursen så här stabilt.
Hursomhelst, hypotesen är att det förutom stoplossar till salu även finns stora intressen i det som nyss var en stödzon. Hit ska vi tillbaka igen för att tanka BTC.
Kommer vi hit så blir det antingen upp eller ner (som vanligt vet vi inte)... men blir det upp så får vi sannolikt en kraftig reaktion.
Därför tar jag här en lång position på lång sikt.

Börser tappar kryptotillgångar: Optimism eller regleringseffekt?OnChain-analyser(Glassnode) för BTC och ETH visar nu på rekordhöga flöden ut från börserna. Sådana flöden anses tyda på att stora aktörer stoppar undan tillgångarna i långtidsförvar(cold wallets) eftersom värdet antas öka under en längre tid. Förutom själva företeelsen, så förväntas den minskade tillgången (vilket blir ett faktum) av BTC och ETH att driva upp priserna.
Det intressanta är om on-chain-företeelsen är på grund av optimism eller om den har en alternativ förklaring i den infrastrukturplan som senaten i USA drev igenom den 6:e augusti.
Förvisso är det länge kvar innan den tar laga kraft då kongressen röstar igenom den. Men redan nu börjar de stora börserna såsom Binance och Coinbase införa nya regler på bred fornt.
Hos Bianance minskas möjligheterna att ta ut sina kryptovalutor till privata adresser för de användare som fortfarande är anonyma fr.o.m den 23:e augusti.
En tanke blir då att en alternativ anledningen till de stora utflödena just nu är ett sätt för stora aktörer att säkra upp sina tillgångar och slippa rapportera till IRS.
Bör tilläggas att regleringarna kan ses som en stor seger för kryptovärlden, då den tas på allvar och antagligen kommer att finnas kvar i någon form över lång tid framöver.

BTC trend neråt 1-2 veckor till?Denna trend analys är gjort på Heikin Ashi candles, tar du vanliga candelsticks så visar det annat, men Heikin Ashi är bra för visa direktion av trend och det är just vad denna analys går ut på:
Flera indikatorer på vecko charten visar en fortsatt trend neråt för Bitcoin ett tag till 1-3 veckor enligt mig.
Ichimoku lagging span visar neråt likaså molnet verkar gå sidledes.
Bollinger Bands pekar fortfarande neråt och har inte börjat vända.
Just nu är det 50 MA som håller support, tappar vi det support är nästa target $28802 , går vi lägre än så, då är 26-27k nästa destination.
0.382 FIB retracement är på $26139.
Stoch RSI är på översålt men vi har inte fått en tydlig kors där.
MACD likaså och lägre volymer senaste veckorna kan tyda på ännu en dip lite lägre för sen fortsätta uppåt.
Troligtvis en sista shakeout för få ut emotionella traders.

BTCUSDT - faller.Som vi kan se på den dagliga tidsramen, från och med 20 maj, flyttade priset i en sidledskanal och BTCUSDT-priset hoppade från 33 000 till 40 000. Den 21 juni bröt priset igenom supportlinjen på 33 000 och började falla. Priset kommer troligen att sjunka till 25 000.
Om du gillar idén, prenumerera och gilla den.
Lycka till och stora vinster.

BTCUSDT vad är nästa?Som vi kan se i tio dagar rör sig priset i sidled, antingen testar supportnivån till $ 33448 och testar sedan motståndsnivån till $ 42191. Nu har priset testat supportnivån och studsat tillbaka. Det är fullt möjligt att priset nu sjunker till supportnivån igen och bryter det, då kan priset sjunka till $ 30 000. Om priset stiger kommer det att testa motståndsnivån, om det bryter igenom det och konsoliderar sig bakom det, det finns en chans att växa till $ 45.000 - $ 50.000 .
Om du gillar idén, prenumerera och gilla den.
Lycka till och stora vinster.


BTCUSDTLooking for a long position after the current retracement is complete together with a new higher low.
Then an outbreak from the falling channel to tp area!
