The cleanest if clean double bottoms incomingDouble bottoms everywhere but I especially like this on the monthly where the previous candle closed above the red support and the green current candle looks like it will close above it as well.
AMAZING! Just a shame at the pain many endured from this stock... ruthless world
Not financial advice
Next report date
≈
June 9
Report period
Q2 2025
EPS estimate
−1.43 USD
Revenue estimate
32.44 M USD
−7.81 USD
−126.01 M USD
112.13 M USD
22.63 M
About FuelCell Energy, Inc.
Sector
Industry
CEO
Jason B. Few
Website
Headquarters
Danbury
Founded
1969
FIGI
BBG000HQ1LB3
FuelCell Energy, Inc. engages in the business of developing, designing, producing, constructing, and servicing high temperature fuel cells for clean electric power generation. It operates through the following geographical segments: the United States, South Korea, and Europe. The company was founded by Bernard Baker and Martin G. Klein in 1969 and is headquartered in Danbury, CT.
−160%
−140%
−120%
−100%
−80%
Q1 '24
Q2 '24
Q3 '24
Q4 '24
Q1 '25
−50.00 M
−25.00 M
0.00
25.00 M
50.00 M
Revenue
Net income
Net margin %
Revenue
COGS
Gross profit
Op expenses
Op income
Non-Op income/ expenses
Taxes & Other
Net income
−34.00 M
−17.00 M
0.00
17.00 M
34.00 M
Revenue
COGS
Gross profit
Expenses & adjustments
Net income
−30.00 M
−15.00 M
0.00
15.00 M
30.00 M
Q1 '24
Q2 '24
Q3 '24
Q4 '24
Q1 '25
−110.00 M
0.00
110.00 M
220.00 M
330.00 M
Debt
Free cash flow
Cash & equivalents
No news here
Looks like there's nothing to report right now

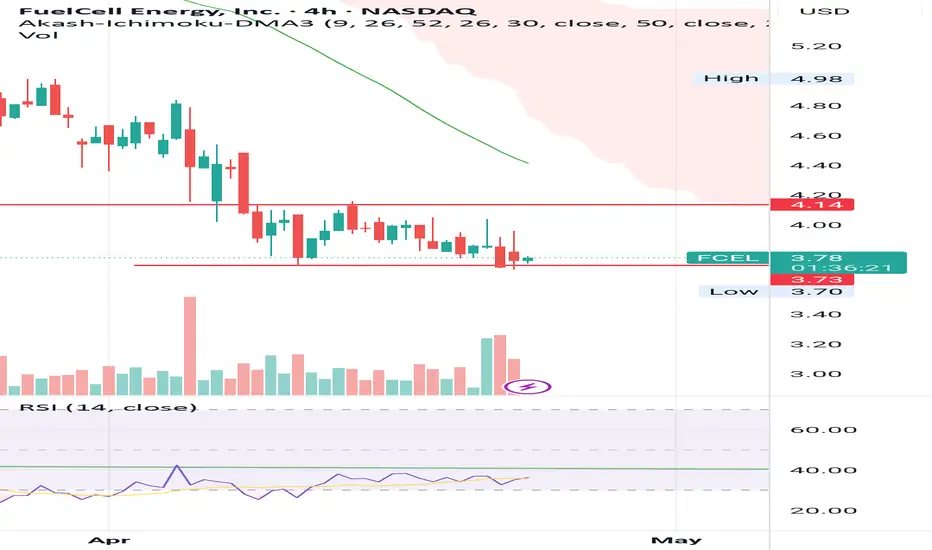
Trade Setup Summary – Long Bias!🟢
Ticker: FCEL
Timeframe: 30-min chart
Current Price: $5.48
% Change: +39.09%
🔍 Technical Highlights
Price is breaking out of a wedge-like pattern, signaling bullish strength.
Breakout confirmation is marked at the yellow circle.
Volume is strong, indicating trader interest and momentum.
🎯 Trad


FCEL - 6 years later *spongebob*POTENTIAL DOUBLE BOTTOM
New low so potential bullish divergence
Not financial advice
Very long term hold imho

FCEL UpdateRemember this garbage? LOL, it reverse split at least a couple of times, so peak COVID price is much higher.
With Trump in office, probably gonna go bankrupt.

FCEL bullish divergence at double bottomI wonder what the earnings will show 👀
Make or break point for FCEL. I own some.
Not financial advice.

FCEL at the lowsImho fuel cell is a good gamble right now for a small investment
The new nasdaq rules suggest it is in their interest to keep the SP going up. This alongside the partnerships and products they sell - looks very good for the future.
Long term hold. Has potential to base here for a year or two ...

Reversal needed on Day and breakout needed on HourlyOn the daily chart FCEL price is resting on the bottom of a bullish FVG and on top of a supply zone in the bottom of an upward parallel channel, there is a chance there might be a price reversal due to price position in the parallel channel and in the FVG, but the trader must be cautious of consolid

See all ideas
Summarizing what the indicators are suggesting.
Neutral
SellBuy
Strong sellStrong buy
Strong sellSellNeutralBuyStrong buy
Neutral
SellBuy
Strong sellStrong buy
Strong sellSellNeutralBuyStrong buy
Neutral
SellBuy
Strong sellStrong buy
Strong sellSellNeutralBuyStrong buy
An aggregate view of professional's ratings.
Neutral
SellBuy
Strong sellStrong buy
Strong sellSellNeutralBuyStrong buy
Neutral
SellBuy
Strong sellStrong buy
Strong sellSellNeutralBuyStrong buy
Neutral
SellBuy
Strong sellStrong buy
Strong sellSellNeutralBuyStrong buy
Displays a symbol's price movements over previous years to identify recurring trends.
Curated watchlists where FCEL is featured.

Frequently Asked Questions
The current price of FCEL is 5.78 USD — it has increased by 5.47% in the past 24 hours. Watch FuelCell Energy, Inc. stock price performance more closely on the chart.
Depending on the exchange, the stock ticker may vary. For instance, on NASDAQ exchange FuelCell Energy, Inc. stocks are traded under the ticker FCEL.
FCEL stock has risen by 18.10% compared to the previous week, the month change is a 50.78% rise, over the last year FuelCell Energy, Inc. has showed a −77.28% decrease.
We've gathered analysts' opinions on FuelCell Energy, Inc. future price: according to them, FCEL price has a max estimate of 12.00 USD and a min estimate of 4.50 USD. Watch FCEL chart and read a more detailed FuelCell Energy, Inc. stock forecast: see what analysts think of FuelCell Energy, Inc. and suggest that you do with its stocks.
FCEL reached its all-time high on Oct 3, 2000 with the price of 234,993.96 USD, and its all-time low was 3.58 USD and was reached on May 6, 2025. View more price dynamics on FCEL chart.
See other stocks reaching their highest and lowest prices.
See other stocks reaching their highest and lowest prices.
FCEL stock is 21.41% volatile and has beta coefficient of −0.09. Track FuelCell Energy, Inc. stock price on the chart and check out the list of the most volatile stocks — is FuelCell Energy, Inc. there?
Today FuelCell Energy, Inc. has the market capitalization of 131.29 M, it has increased by 12.30% over the last week.
Yes, you can track FuelCell Energy, Inc. financials in yearly and quarterly reports right on TradingView.
FuelCell Energy, Inc. is going to release the next earnings report on Jun 9, 2025. Keep track of upcoming events with our Earnings Calendar.
FCEL earnings for the last quarter are −1.42 USD per share, whereas the estimation was −1.48 USD resulting in a 3.94% surprise. The estimated earnings for the next quarter are −1.43 USD per share. See more details about FuelCell Energy, Inc. earnings.
FuelCell Energy, Inc. revenue for the last quarter amounts to 19.00 M USD, despite the estimated figure of 33.49 M USD. In the next quarter, revenue is expected to reach 32.44 M USD.
FCEL net income for the last quarter is −28.33 M USD, while the quarter before that showed −41.42 M USD of net income which accounts for 31.61% change. Track more FuelCell Energy, Inc. financial stats to get the full picture.
No, FCEL doesn't pay any dividends to its shareholders. But don't worry, we've prepared a list of high-dividend stocks for you.
As of May 28, 2025, the company has 584 employees. See our rating of the largest employees — is FuelCell Energy, Inc. on this list?
EBITDA measures a company's operating performance, its growth signifies an improvement in the efficiency of a company. FuelCell Energy, Inc. EBITDA is −105.96 M USD, and current EBITDA margin is −105.65%. See more stats in FuelCell Energy, Inc. financial statements.
Like other stocks, FCEL shares are traded on stock exchanges, e.g. Nasdaq, Nyse, Euronext, and the easiest way to buy them is through an online stock broker. To do this, you need to open an account and follow a broker's procedures, then start trading. You can trade FuelCell Energy, Inc. stock right from TradingView charts — choose your broker and connect to your account.
Investing in stocks requires a comprehensive research: you should carefully study all the available data, e.g. company's financials, related news, and its technical analysis. So FuelCell Energy, Inc. technincal analysis shows the buy rating today, and its 1 week rating is sell. Since market conditions are prone to changes, it's worth looking a bit further into the future — according to the 1 month rating FuelCell Energy, Inc. stock shows the sell signal. See more of FuelCell Energy, Inc. technicals for a more comprehensive analysis.
If you're still not sure, try looking for inspiration in our curated watchlists.
If you're still not sure, try looking for inspiration in our curated watchlists.