current price action is slightly higher than the previous breakoAs the drone industry progresses there should be a shift in demand for remote controlled drone operations. With the use cases being available for customers in rail, energy, public safety, critical infrastructure, and government markets with mission-critical networks, autonomous drones, counter-dron
Next report date
≈
August 18
Report period
Q2 2025
EPS estimate
−0.09 USD
Revenue estimate
4.97 M USD
−0.5820 USD
−38.01 M USD
7.19 M USD
121.13 M
About Ondas Holdings Inc.
Sector
Industry
CEO
Eric Ashley Brock
Website
Headquarters
Boston
Founded
2014
FIGI
BBG009HYYCD9
Ondas Holdings, Inc. engages in the development, marketing, and sale of wireless radio systems for secure, wide area mission-critical business-to-business networks. It operates through the Ondas Networks and Ondas Autonomous Systems segments. The Ondas Networks segment provides wireless connectivity solutions enabling mission-critical Industrial Internet applications and services. The Ondas Autonomous Systems segment designs, develops, and markets commercial drone solutions via the Optimus System and Scout System. The company was founded on December 22, 2014 and is headquartered in Boston, MA.
−1,650.00%
−1,300.00%
−950.00%
−600.00%
−250.00%
Q1 '24
Q2 '24
Q3 '24
Q4 '24
Q1 '25
−15.00 M
−10.00 M
−5.00 M
0.00
5.00 M
Revenue
Net income
Net margin %
Revenue
COGS
Gross profit
Op expenses
Op income
Non-Op income/ expenses
Taxes & Other
Net income
−15.00 M
−10.00 M
−5.00 M
0.00
5.00 M
Revenue
COGS
Gross profit
Expenses & adjustments
Net income
−15.00 M
−10.00 M
−5.00 M
0.00
5.00 M
Q1 '24
Q2 '24
Q3 '24
Q4 '24
Q1 '25
−21.00 M
0.00
21.00 M
42.00 M
63.00 M
Debt
Free cash flow
Cash & equivalents
No news here
Looks like there's nothing to report right now

ONDS Long Trade Setup | Entry, SL, T1, T2!Type: Long Trade 📈
Entry Point: $2.01 (marked breakout level)
Stop Loss (SL): $1.78 (marked in red) 🚫
Target 1 (T1): $2.32 (marked in yellow) 🟡
Target 2 (T2): $2.48 (marked in green) ✅
Reason for Long: Symmetrical triangle breakout pattern, suggesting bullish momentum is likely to continue. The brea

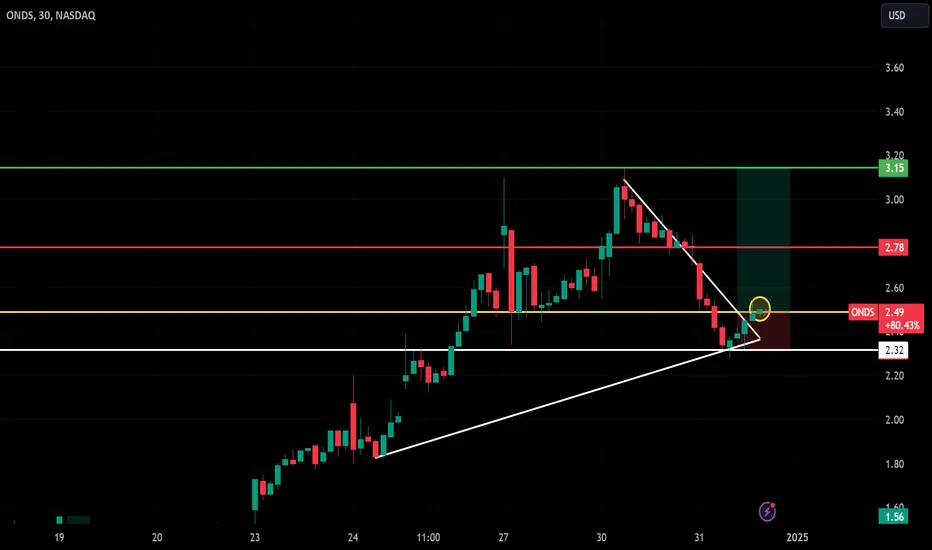
ONDS Triangle Support Setup with Breakout Potential!
Key Details:**
- **Entry Point:** $2.49
- **Stop Loss:** $2.32
- **Take Profit Targets:**
- **T1:** $2.78
- **T2:** $3.15
This setup highlights a triangle support pattern with potential for a bullish breakout. Key risk-to-reward levels are identified for profitable trades. 📈 Monitor cl

ONDSI am thinking to buy at 9.41 and sell at 9.81 and 10.54
DISCLAIMER:
I am not a financial or investment advisor. All information found here, including any ideas, opinions, views, predictions, forecasts, commentaries, suggestions, or stock picks, expressed, or implied herein, are for entertainment pu


See all ideas
Summarizing what the indicators are suggesting.
Neutral
SellBuy
Strong sellStrong buy
Strong sellSellNeutralBuyStrong buy
Neutral
SellBuy
Strong sellStrong buy
Strong sellSellNeutralBuyStrong buy
Neutral
SellBuy
Strong sellStrong buy
Strong sellSellNeutralBuyStrong buy
An aggregate view of professional's ratings.
Neutral
SellBuy
Strong sellStrong buy
Strong sellSellNeutralBuyStrong buy
Neutral
SellBuy
Strong sellStrong buy
Strong sellSellNeutralBuyStrong buy
Neutral
SellBuy
Strong sellStrong buy
Strong sellSellNeutralBuyStrong buy
Displays a symbol's price movements over previous years to identify recurring trends.
Frequently Asked Questions
The current price of ONDS is 0.9093 USD — it has increased by 5.11% in the past 24 hours. Watch Ondas Holdings Inc. stock price performance more closely on the chart.
Depending on the exchange, the stock ticker may vary. For instance, on NASDAQ exchange Ondas Holdings Inc. stocks are traded under the ticker ONDS.
ONDS stock has risen by 7.10% compared to the previous week, the month change is a 10.88% rise, over the last year Ondas Holdings Inc. has showed a 29.90% increase.
We've gathered analysts' opinions on Ondas Holdings Inc. future price: according to them, ONDS price has a max estimate of 2.50 USD and a min estimate of 1.50 USD. Watch ONDS chart and read a more detailed Ondas Holdings Inc. stock forecast: see what analysts think of Ondas Holdings Inc. and suggest that you do with its stocks.
ONDS reached its all-time high on Nov 27, 2019 with the price of 19.5000 USD, and its all-time low was 0.3146 USD and was reached on Oct 26, 2023. View more price dynamics on ONDS chart.
See other stocks reaching their highest and lowest prices.
See other stocks reaching their highest and lowest prices.
ONDS stock is 8.95% volatile and has beta coefficient of 1.23. Track Ondas Holdings Inc. stock price on the chart and check out the list of the most volatile stocks — is Ondas Holdings Inc. there?
Today Ondas Holdings Inc. has the market capitalization of 124.96 M, it has increased by 14.63% over the last week.
Yes, you can track Ondas Holdings Inc. financials in yearly and quarterly reports right on TradingView.
Ondas Holdings Inc. is going to release the next earnings report on Aug 18, 2025. Keep track of upcoming events with our Earnings Calendar.
ONDS earnings for the last quarter are −0.15 USD per share, whereas the estimation was −0.10 USD resulting in a −53.06% surprise. The estimated earnings for the next quarter are −0.09 USD per share. See more details about Ondas Holdings Inc. earnings.
Ondas Holdings Inc. revenue for the last quarter amounts to 4.25 M USD, despite the estimated figure of 4.94 M USD. In the next quarter, revenue is expected to reach 4.97 M USD.
ONDS net income for the last quarter is −14.14 M USD, while the quarter before that showed −10.34 M USD of net income which accounts for −36.77% change. Track more Ondas Holdings Inc. financial stats to get the full picture.
No, ONDS doesn't pay any dividends to its shareholders. But don't worry, we've prepared a list of high-dividend stocks for you.
As of May 23, 2025, the company has 124 employees. See our rating of the largest employees — is Ondas Holdings Inc. on this list?
EBITDA measures a company's operating performance, its growth signifies an improvement in the efficiency of a company. Ondas Holdings Inc. EBITDA is −30.08 M USD, and current EBITDA margin is −402.42%. See more stats in Ondas Holdings Inc. financial statements.
Like other stocks, ONDS shares are traded on stock exchanges, e.g. Nasdaq, Nyse, Euronext, and the easiest way to buy them is through an online stock broker. To do this, you need to open an account and follow a broker's procedures, then start trading. You can trade Ondas Holdings Inc. stock right from TradingView charts — choose your broker and connect to your account.
Investing in stocks requires a comprehensive research: you should carefully study all the available data, e.g. company's financials, related news, and its technical analysis. So Ondas Holdings Inc. technincal analysis shows the buy rating today, and its 1 week rating is sell. Since market conditions are prone to changes, it's worth looking a bit further into the future — according to the 1 month rating Ondas Holdings Inc. stock shows the sell signal. See more of Ondas Holdings Inc. technicals for a more comprehensive analysis.
If you're still not sure, try looking for inspiration in our curated watchlists.
If you're still not sure, try looking for inspiration in our curated watchlists.