LONG 4HR Wave Count Possibilities
Using the Weekly time frame, Wave 1+3 of a larger degree shows a possible extension to the 1.68 extension which is a common wave 5 of a larger degree target . That Price Target being $26.35.
In April of this year the price reacted to a Reversal Pivot Point but failed to form a proper impulse for
SoFi Technologies, Inc.
18.57USDR
+0.45+2.48%
At close at Jul 3, 20:59 GMT
USD
No trades
Next report date
—
Report period
Q2 2025
EPS estimate
0.06 USD
Revenue estimate
801.80 M USD
0.43 USD
498.67 M USD
3.77 B USD
1.08 B
About SoFi Technologies, Inc.
Sector
Industry
CEO
Anthony J. Noto
Website
Headquarters
San Francisco
Founded
2011
FIGI
BBG00YB1ZD58
SoFi Technologies, Inc. is a financial service platform, which engages in the provision of student loan refinancing options to the private student loan market. It operates through the following segments: Lending, Technology Platform, and Financial Services. The Lending segment offers personal loans, student loans, home loan products, and related servicing activities. The Technology Platform segment focuses on technology products and solutions revenue. The Financial Services segment includes the SoFi Money product, SoFi Invest product, SoFi Credit Card product, SoFi Relay personal finance management product, and other financial services such as lead generation and content for other financial services institutions. The company was founded in 2011 and is headquartered in San Francisco, CA.
2%
10%
18%
26%
34%
Q1 '24
Q2 '24
Q3 '24
Q4 '24
Q1 '25
0.00
300.00 M
600.00 M
900.00 M
1.20 B
Revenue
Net income
Net margin %
Revenue
Op expenses
Op income
Int expenses
Non-op income/expenses
Pretax income
Taxes & Other
Net income
0.00
300.00 M
600.00 M
900.00 M
1.20 B
Revenue
Op expenses
Op income
Expenses & adjustments
Net income
0.00
300.00 M
600.00 M
900.00 M
1.20 B
No news here
Looks like there's nothing to report right now

Cup and Handle - 67% Upside if we get the CUTS As of Friday, June 27, 2025, at 9:01:38 PM PDT, here's a breakdown of SoFi Technologies Inc. (SOFI) stock:
Current Price & Performance:
Last Price: $17.18 (as of 4:00 PM ET on June 27, 2025)
Today's Change: Up $0.41 (2.44%)
After-hours price: $17.22 (up 0.23% as of 8:00 PM ET on June 27, 2025)

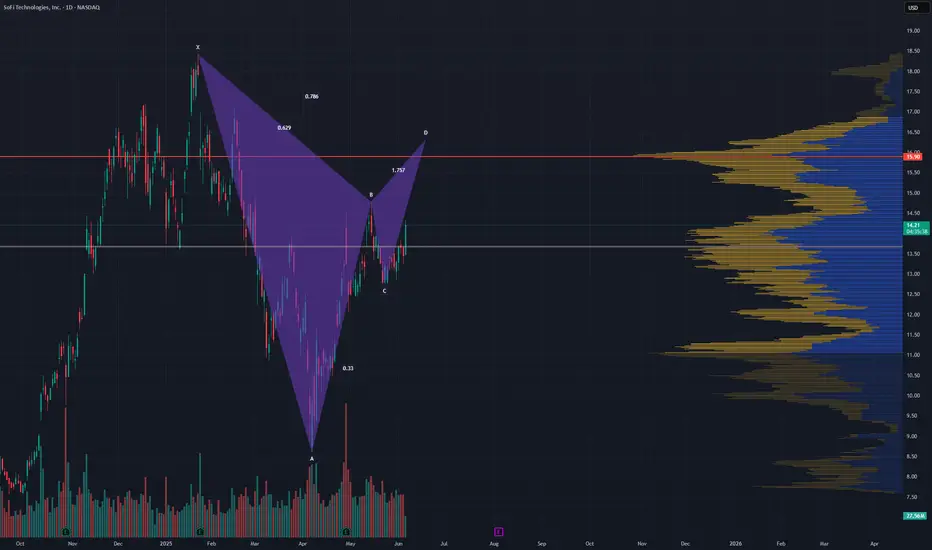
SoFi Technologies (SOFI, 1D)On the daily chart, SoFi has broken out of its descending trendline, confirmed the breakout with a clean retest of the 0.618 Fibonacci retracement level at $12.33, and is now building upward momentum from this demand zone. This “buy zone” is acting as a launchpad for a potential mid-term move toward

Super performance candidate NASDAQ:SOFI has shown strong quarterly earning's growth, with its latest earnings quarter reporting 30% YoY, improving from losses to profits at an impressive rate
Being positioned as a Leader in the FinTech sector and significant institutional adoption, reflecting investor appetite and confidence

SOFI Long Setup – 2.83 Risk/RewardSOFI looks ready for a breakout. The price is consolidating just above the cloud after reclaiming the Kijun line. This setup offers solid upside if momentum follows through.
Entry: ~$13.46
Target: $16.37 (21.6% upside)
Stop: $12.43 (7.65% downside)
Risk/Reward: 2.83
Why I like this trade:
Clear su

SOFI Classic BUMBUM Breakout !I think I am beginning to like this classic bumbum formation.
NASDAQ:SOFI broke from the classic bumbum formation and retraced back to its support levels at $8.
It has recently started making a bullish reversal move back to $15, in the turn forming an inverse head and shoulder formation.
If t
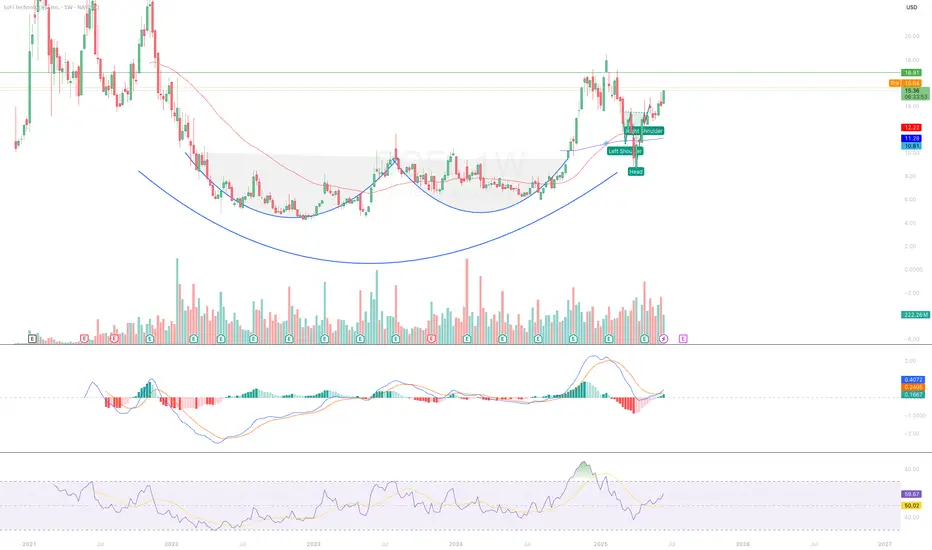
Long for now but would suggest taking profits. Even though major move already happened, I can see it going to 20-21.5 before we hit supply and head lower into next buy zone, unfortunately I don't see strong support until 15 area. Macd's play a role as momentum from buying is going to turn into selling soon.


See all ideas
Summarizing what the indicators are suggesting.
Neutral
SellBuy
Strong sellStrong buy
Strong sellSellNeutralBuyStrong buy
Neutral
SellBuy
Strong sellStrong buy
Strong sellSellNeutralBuyStrong buy
Neutral
SellBuy
Strong sellStrong buy
Strong sellSellNeutralBuyStrong buy
An aggregate view of professional's ratings.
Neutral
SellBuy
Strong sellStrong buy
Strong sellSellNeutralBuyStrong buy
Neutral
SellBuy
Strong sellStrong buy
Strong sellSellNeutralBuyStrong buy
Neutral
SellBuy
Strong sellStrong buy
Strong sellSellNeutralBuyStrong buy
Displays a symbol's price movements over previous years to identify recurring trends.
US83406FAA0
SOFI TECH. 21/26 ZO CVYield to maturity
−6.53%
Maturity date
Oct 15, 2026
US83406FAC6
SOFI TECH. 24/29 CV 144Yield to maturity
−13.07%
Maturity date
Mar 15, 2029
See all SOFI bonds
Curated watchlists where SOFI is featured.


Frequently Asked Questions
The current price of SOFI is 18.57 USD — it has increased by 2.48% in the past 24 hours. Watch SoFi Technologies, Inc. stock price performance more closely on the chart.
Depending on the exchange, the stock ticker may vary. For instance, on NASDAQ exchange SoFi Technologies, Inc. stocks are traded under the ticker SOFI.
SOFI stock has risen by 13.11% compared to the previous week, the month change is a 36.45% rise, over the last year SoFi Technologies, Inc. has showed a 186.57% increase.
We've gathered analysts' opinions on SoFi Technologies, Inc. future price: according to them, SOFI price has a max estimate of 20.00 USD and a min estimate of 6.00 USD. Watch SOFI chart and read a more detailed SoFi Technologies, Inc. stock forecast: see what analysts think of SoFi Technologies, Inc. and suggest that you do with its stocks.
SOFI reached its all-time high on Feb 1, 2021 with the price of 28.26 USD, and its all-time low was 4.24 USD and was reached on Dec 7, 2022. View more price dynamics on SOFI chart.
See other stocks reaching their highest and lowest prices.
See other stocks reaching their highest and lowest prices.
SOFI stock is 3.10% volatile and has beta coefficient of 2.43. Track SoFi Technologies, Inc. stock price on the chart and check out the list of the most volatile stocks — is SoFi Technologies, Inc. there?
Today SoFi Technologies, Inc. has the market capitalization of 20.03 B, it has increased by 2.01% over the last week.
Yes, you can track SoFi Technologies, Inc. financials in yearly and quarterly reports right on TradingView.
SoFi Technologies, Inc. is going to release the next earnings report on Jul 29, 2025. Keep track of upcoming events with our Earnings Calendar.
SOFI earnings for the last quarter are 0.06 USD per share, whereas the estimation was 0.03 USD resulting in a 84.00% surprise. The estimated earnings for the next quarter are 0.06 USD per share. See more details about SoFi Technologies, Inc. earnings.
SoFi Technologies, Inc. revenue for the last quarter amounts to 770.72 M USD, despite the estimated figure of 738.98 M USD. In the next quarter, revenue is expected to reach 801.80 M USD.
SOFI net income for the last quarter is 71.12 M USD, while the quarter before that showed 332.47 M USD of net income which accounts for −78.61% change. Track more SoFi Technologies, Inc. financial stats to get the full picture.
No, SOFI doesn't pay any dividends to its shareholders. But don't worry, we've prepared a list of high-dividend stocks for you.
As of Jul 4, 2025, the company has 5 K employees. See our rating of the largest employees — is SoFi Technologies, Inc. on this list?
EBITDA measures a company's operating performance, its growth signifies an improvement in the efficiency of a company. SoFi Technologies, Inc. EBITDA is 585.15 M USD, and current EBITDA margin is 16.72%. See more stats in SoFi Technologies, Inc. financial statements.
Like other stocks, SOFI shares are traded on stock exchanges, e.g. Nasdaq, Nyse, Euronext, and the easiest way to buy them is through an online stock broker. To do this, you need to open an account and follow a broker's procedures, then start trading. You can trade SoFi Technologies, Inc. stock right from TradingView charts — choose your broker and connect to your account.
Investing in stocks requires a comprehensive research: you should carefully study all the available data, e.g. company's financials, related news, and its technical analysis. So SoFi Technologies, Inc. technincal analysis shows the buy rating today, and its 1 week rating is strong buy. Since market conditions are prone to changes, it's worth looking a bit further into the future — according to the 1 month rating SoFi Technologies, Inc. stock shows the strong buy signal. See more of SoFi Technologies, Inc. technicals for a more comprehensive analysis.
If you're still not sure, try looking for inspiration in our curated watchlists.
If you're still not sure, try looking for inspiration in our curated watchlists.