BABA oversoldA very big opportunity in the charts. RSI at 25 in the daily, and MACD touching the broadening wedge in the weekly.
Bright future in the stock's price for the next year despite the exponential growth curve has been broken.
Buy order at (50%) 1.414 ($199.37) and other one (50%) at 1.618 ($188.57).
Key facts today
Next report date
≈
August 14
Report period
Q1 2025
EPS estimate
2.35 USD
Revenue estimate
35.63 B USD
7.66 USD
17.94 B USD
138.03 B USD
2.39 B
About Alibaba Group Holdings Ltd.
Sector
Industry
CEO
Yong Ming Eddie Wu
Website
Headquarters
Hangzhou
Founded
1999
FIGI
BBG006G2JVL2
Alibaba Group Holding Ltd engages in providing online and mobile marketplaces in retail and wholesale trade. It operates through the following business segments: Core Commerce; Cloud Computing; Digital Media & Entertainment; and Innovation Initiatives and Others. The Core Commerce segment comprises of platforms operating in retail and wholesale. The Cloud Computing segment consists of Alibaba Cloud, which offers elastic computing, database, storage and content delivery network, large scale computing, security, management and application, big data analytics, a machine learning platform, and other services provide for enterprises of different sizes across various industries. The Digital Media & Entertainment segment relates to the Youko Tudou and UC Browser business. The Innovation Initiatives and Others segment includes businesses such as AutoNavi, DingTalk, Tmall Genie, and others. The company was founded by Chung Tsai and Yun Ma on June 28, 1999 and is headquartered in Hangzhou, China.
1%
6%
11%
16%
21%
Q4 '23
Q1 '24
Q2 '24
Q3 '24
Q4 '24
0.00
10.00 B
20.00 B
30.00 B
40.00 B
Revenue
Net income
Net margin %
Revenue
COGS
Gross profit
Op expenses
Op income
Non-Op income/ expenses
Taxes & Other
Net income
0.00
9.00 B
18.00 B
27.00 B
36.00 B
Revenue
COGS
Gross profit
Expenses & adjustments
Net income
0.00
9.00 B
18.00 B
27.00 B
36.00 B
Q4 '23
Q1 '24
Q2 '24
Q3 '24
Q4 '24
−15.00 B
0.00
15.00 B
30.00 B
45.00 B
Debt
Free cash flow
Cash & equivalents
No news here
Looks like there's nothing to report right now

BABA - when to buy?hi Traders
Today we are analyzing Alibaba Group Holdings Ltd. (NYSE:BABA) on a 4hour chart basis.
Alibaba stock is currently trading at $124
We expect that the price will get rejected at the downsloping resistance and in some time it will come back down to retest the support level around $100.
F

Alibaba - This was just the obvious bottom!Alibaba - NYSE:BABA - will head much higher:
(click chart above to see the in depth analysis👆🏻)
Ever since Alibaba actually retested the previous all time low in 2022, we have been able to see the textbook creation of a rounding bottom formation. Even the recent break and retest was perfectly

$BABA NYSE:BABA is more than just a stock it’s a global supply chain beast.
I see its real value above $110, and as long as buyers hold that line, more investors will jump in with confidence.
Consumers are squeezed student loans, late car payments but they’re evolving.
AI skills. Side hustles. Smarter

BABA upBABA has followed technical movements very well over time
On the way up:
- it made several nice cups with good follow through to the upside
On the way down:
- it followed my channel height estimate (I learned this mostly from crypto charts)
- nice channel down
Consolidation:
- excellent basing p

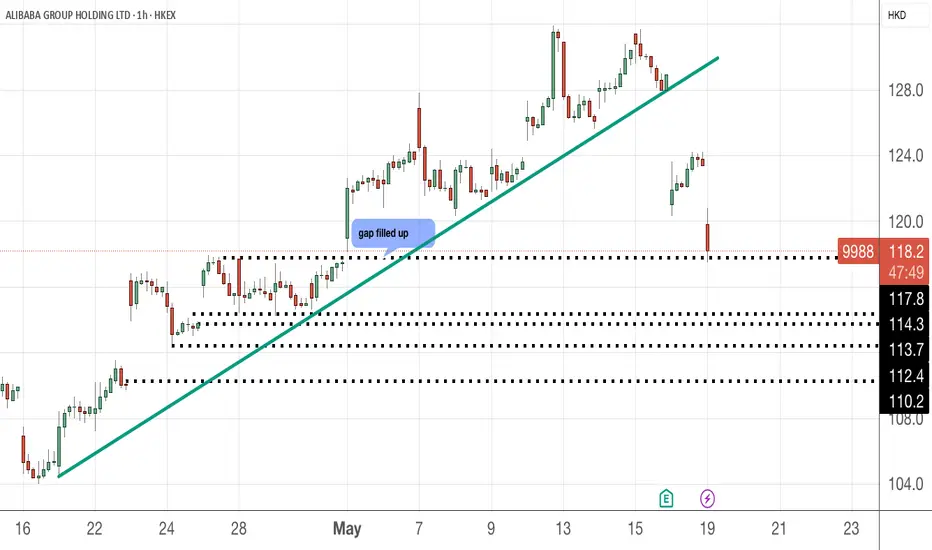
9988 dropped more than 4% .....In the 1H chart, we can see the price action has broken down from the bullish trend line and there are several gaps that it can possibly fill up. The first one at 117.8 is completed. So, if you want to go LONG/accumulate, go in in tranches instead of one lump sum. Yes, you may lose a bit in brokerag

BABA short position - rising wedgehi traders,
Let's have a look at BABA on a 1h time frame.
After reaching approx.140$ levels, BABA experienced a significant correction and visited the 96$ level, which could very well be a bottom here.
After reaching 96$, the price has been forming a rising wedge pattern.
When the majority switche

Alibaba (BABA) is going down ?Market
Broader China Tech – CQQQ – Tracks a wide range of Chinese technology companies.
Large-cap China exposure – FXI – Focuses on major Chinese companies, including Alibaba.
Stock: Alibaba (BABA)
The stock has recently fallen below its 50-day moving average, indicating short-term weakn

Alibaba - This Chart Speaks In Money!Alibaba ( NYSE:BABA ) prepares for a significant pump:
Click chart above to see the detailed analysis👆🏻
Basically since Alibaba was listed on the NYSE, it always perfectly respected market structure. With the recent rejection away from the key neckline, Alibaba is now creating a bullish break

See all ideas
Summarizing what the indicators are suggesting.
Neutral
SellBuy
Strong sellStrong buy
Strong sellSellNeutralBuyStrong buy
Neutral
SellBuy
Strong sellStrong buy
Strong sellSellNeutralBuyStrong buy
Neutral
SellBuy
Strong sellStrong buy
Strong sellSellNeutralBuyStrong buy
An aggregate view of professional's ratings.
Neutral
SellBuy
Strong sellStrong buy
Strong sellSellNeutralBuyStrong buy
Neutral
SellBuy
Strong sellStrong buy
Strong sellSellNeutralBuyStrong buy
Neutral
SellBuy
Strong sellStrong buy
Strong sellSellNeutralBuyStrong buy
Displays a symbol's price movements over previous years to identify recurring trends.
Curated watchlists where BABA is featured.


