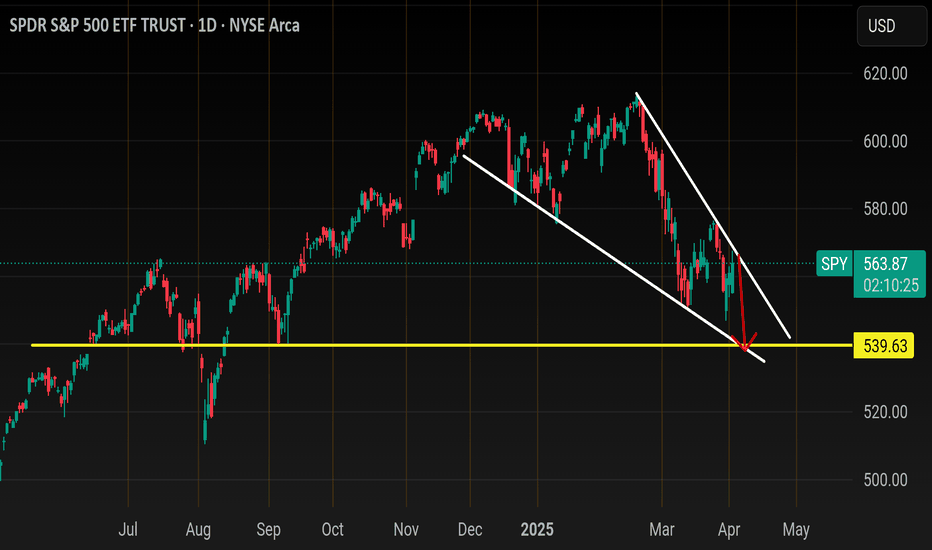
I think we have one more leg down to 538-540 before earnings season kicks off next week .. NASDAQ:QQQ and TVC:DJI showing same chart I will update this more later but I wanted to get this out before market closes... Of course if we gap above trendline resistance and CLOSE above it the the resistance is negated . Another, you see that gap from...
Monster run the last 12 months... To see where we are headed we have to see how we got here Monthly chart Is showing 2 patterns 1. Cup and handle The measured move of this pattern is usually based on the depth of the cup. In this case the depth is 44% and the stock has rallied 50% since 2. The handle part of the cup can be viewed as a Ascending...
Meta has really been then engine behind NASDAQ for the past 8 months.. Nvda and MSFT both took a back seat and traded sideways since mid 2024 but Qqq was able gain another 7% from July high until February Top on a few names and meta was a big player. Going into Q2 and Q3 the technicals are showing me that Meta will most likely take a major Haircut cut this...
Logarithmic chart for the parabolic move White trendlines - Ascending broadening wedge (Bearish) Yellow trendline - Primary trend and final target Looking for a H&S play out here on PLTR for the next 2 quarter.. I don't think this stock ever breaks back over 100.00 this year! The head is forming now and will be completed at 63.00.. then comes the...
My last post on googl (See below) I showed you the rising wedge on googl at 200.. 25% later here we are.. This is a long term view. This the great reset back to the primary trendline.. This is logarithmic, logarithmic or log scale comes in handy to chart stocks or indexes that have made a parabolic move . Here's the monthly trend As you can see , with...
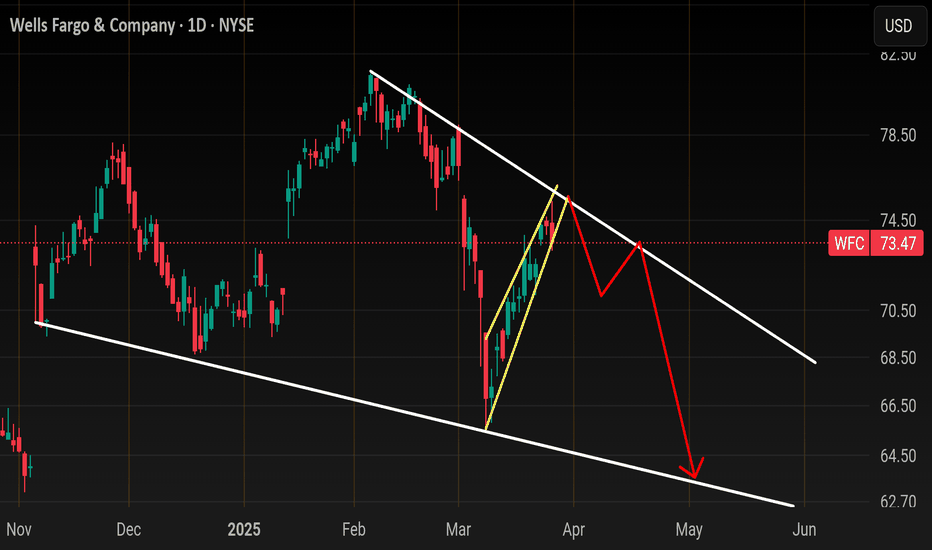
XLF banking sector is rolling over and this is one of the best setups I can find going into earnings Q2... My target is 64 gap close By beginning of May. Stop loss over 76.00 or 50sma. Here's XLF.. same wedge at the 50ma
What's up guys? Here's a update .. I'll cover NYA,Qqq,IWM,XLk,XLF Here's NYA Notice the price action above the yellow line? That's Wyckoff distribution. Yesterday we retest that prior support.. the next leg down on this should start. For more information just research Wyckoff distribution! XLF (Banks) Exact same chart as NYA.. Wyckoff retest... Pain...
Nasty distribution playing out here... End of Q2 target is 320-350 Monthly chart.. Reversal candle In Dec . Structure is sideways for the entire 2024 which is an ENTIRE year of DISTRIBUTION. Weekly chart My minimum target for a Wyckoff off of this size is 345 or as low as the weekly 200ma I don't think we go straight there.. I think in the next 2weeks...
Headed back to 180 price action and trendline support but first a push back to 208-210 (20ma) + theres a gap to close from March 5th I don't think price makes it back over 210 before it take a turn down to 180 BUT if price can close above 211, then we are headed here 215 price action + the weekly 20ma at 217 .. that my extreme long target that will only...
Interesting spot here near 200.00 Honesty it's the most oversold Stock/Index on my watchlist. Actually price has been trading inside this channel here After finishing up a H&S pattern Over the next 2weeks I think we can see a move back to 214 channel top and H&S neckline I don't think that move will be straight V shape either, maybe a pop to 206 or...
When I dive in to charts I like to start at the monthly and zoom out years Monthly view Side ways and trend less . Price is trading between 120-400.. On sideways trends you usually see price return back Demand. Throw on some cute trendlines and you can see the triangle that led to the explosive move.. Trendline support is Around 210.. below 210 cand TSLA is...
Price is overbought on the monthly and weekly money flow and RSI.. This current rang trade is likely distribution Also we are 30% extended from the 50 SMA . This is extreme I would buy this at all up here , I think we will retest 104-108 (Weekly200ma) on a pullback before we break over 150. I don't know when this distribution breaks and price resets...
Weekly chart... White line represents Primary trend since 08 housing crisis crash Blue channel represents price action from 2017 -2025 Now pay attention.. You see the yellow trendlines ? Those represent the up trend from covid crash and 2022 crash. Those were micro uptrends both lasting 2yrs in length.. So now the market has hit a reset switch and I...
So .. Keep things simple.. Qqq has support at 468-470.. below that support at 450 comes... Qqq 1st resistance is at 477, over 477 and 483 comes. .. The technicals say we should bounce up to 483-485 if Jolts come in decent today.. The bad news is Until post Opex we are in a Bearish seasonality.. The structure on one of the biggest sectors XLC (Meta,NFLX)...
Major ascending broadening wedge here .. this is a huge Bearish pattern that I think will take IWM back to 198 and possibly 165. The question is , do we tag upper boundary around 250 before it happens? Let's look closer at the last 2month price action... Bulls will say it's a pennant that will push IWM to 250 Bears see a bear flag What do I see ?...
Earnings this week.. long term channel (Yellow) Mid term channel (White) In my last Amzn post (See link) I said Amzn could grind at the top of it's long term channel after a pullback from 230, and it has.. from 218 - 237 and now we are at a crossroads this earnings.. Both scenarios will end in a massive correction but one scenario could give a 7% pop...
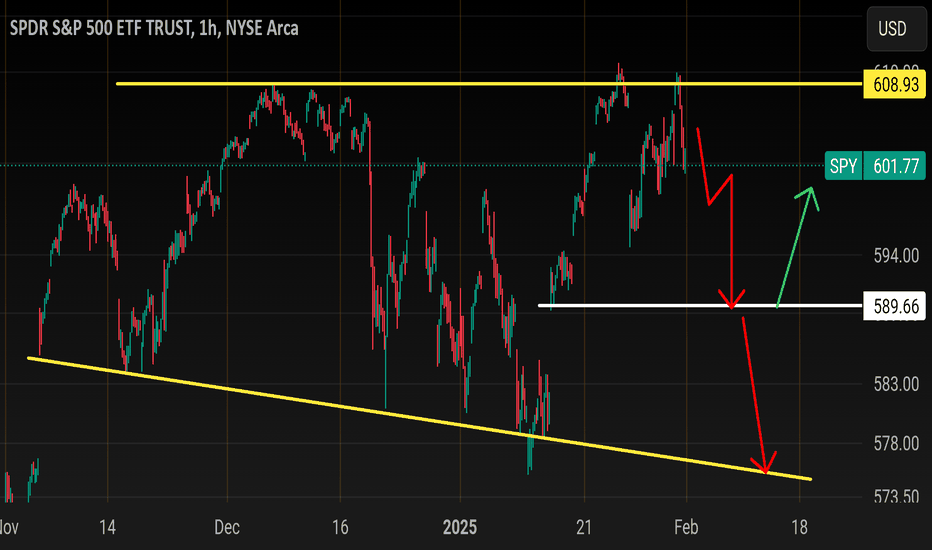
Now turn it around! 2 targets on Spy this week.. the first is 589 gap support.. Also the weekly 20sma is around 589-590 and if you look at your weekly chart fawkery abounds nears the weekly 20. If we break below weekly 20 which I would say is a 50/50 then price will double to back to 575 or lower trendline like so Looking at the charts you'll notice...
Retesting resistance here at 237.. I've outlined with circles .. also retesting 20sma... I don't think price breaks back over this area.. my target is 216 gap, maybe lower but the 200sma must be respected. Stop loss over 240 or 50sma If price breaks back above 242 then I was wrong and 250 is coming


